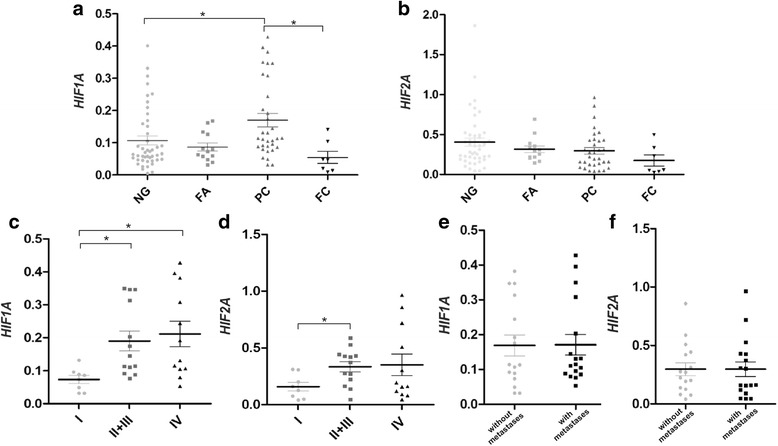
Fig. 1.

Expression of HIF1A and HIF2A mRNA in thyroid lesions. The 2ΔCt (Ctgene–CtGAPDH) method was used to estimate the relative gene expression levels in the analyzed samples. The 2-ΔCt values were re-calculated into relative copy number values (number of HIF-1α or HIF-2α mRNA copies per 1.000 copies of GAPDH mRNA). a and b- relative mRNA expression of HIF1A (a) and HIF2A (b) in samples of nodular goiter (NG; n = 45), follicular adenoma (FA; n = 13), papillary carcinoma (PC; n = 33) and follicular carcinoma (FC; n = 7); c and d –expression of HIF1A and HIF2A in papillary carcinoma samples characterized by different tumor stages (I n = 8; II + III n = 13; IV n = 12); e and f - papillary carcinoma samples of different lymph node metastasis status (with metastases n = 17; without metastases; n = 16). Data represent the means ± SEM, * p < 0.05
