Fig. 1.

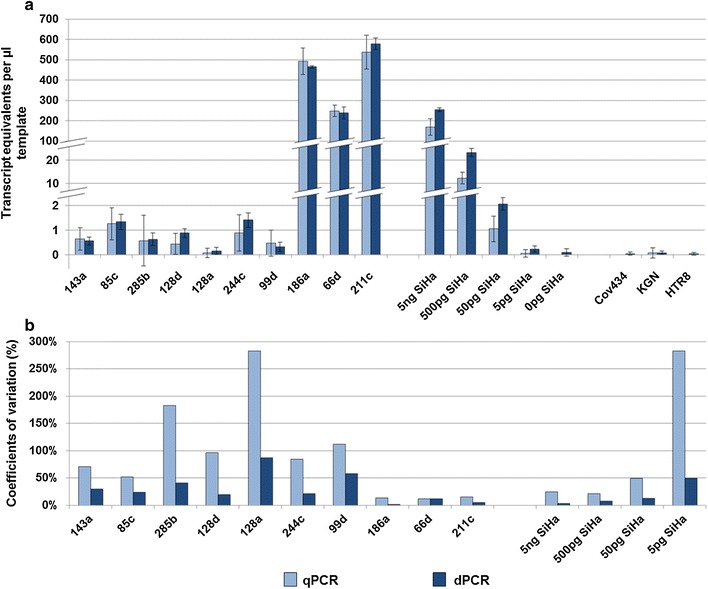
Comparision of qPCR and dPCR. a Results of HPV transcript quantification by both methods. Calculated transcript equivalents per µl template (y-axis) are shown for 10 sentinel lymph nodes, a dilution series of SiHa cells and 3 HPV-negative control cell lines (x-axis). Standard deviations are indicated by error bars. b Detection reliability of the above samples by calculation of coefficients of variations. The coefficients of variation are considerably lower in dPCR analyses. This benefit is especially obvious in samples with a low number of templates
