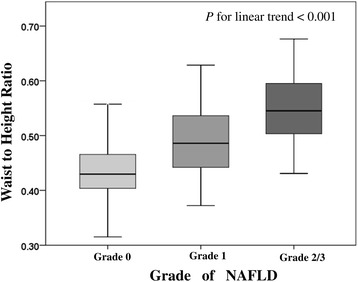
Fig. 2.

Box plots showing comparisons between waist to height ratio (WHtR) and grade of NAFLD. In each group, the central line indicates the median value, the upper and lower lines represent the upper and lower quartiles, and the crosses show the minimum and maximum values. The WHtR differs significantly with the grade of NAFLD (Grade 0, 0.70; Grade 1, 0.97; Grade 2/3, 1.46; linear trend P < 0.001).NAFLD, non-alcoholic fatty liver disease
