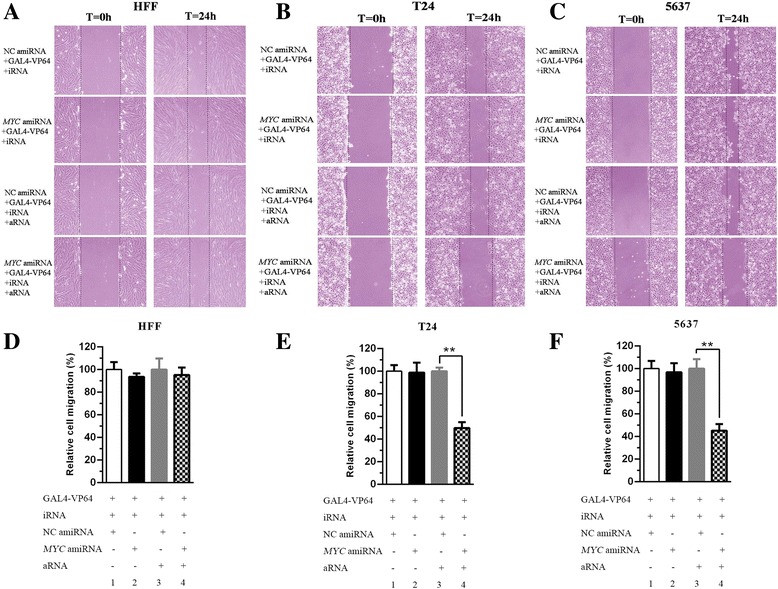
Fig. 6.

Effects of synthetic regulatory RNAs on cell migration. Representative images of each group were shown in HFF (a), T24 (b) and 5637 (c). Without the expression of aRNA, compared with the NC amiRNA + GAL4-VP64 + iRNA group, the relative cell migration was no significant difference in the MYC amiRNA + GAL4-VP64 + iRNA group in HFF, T24 and 5637 (a, b , c, d, e and F, P > 0.05). After expression of aRNA, there was no statistical change in cell migration between these two groups in HFF (a and d, P > 0.05). However, cell migration was significantly decreased in the MYC amiRNA + GAL4-VP64 + iRNA + aRNA group (column 4) compared with the NC amiRNA + GAL4-VP64 + iRNA + aRNA group (column 3) in T24 and 5637 (b, c, d and f, P < 0.01). All data are shown as the mean ± SD (*p < 0.05, **p < 0.01); bar, SD
