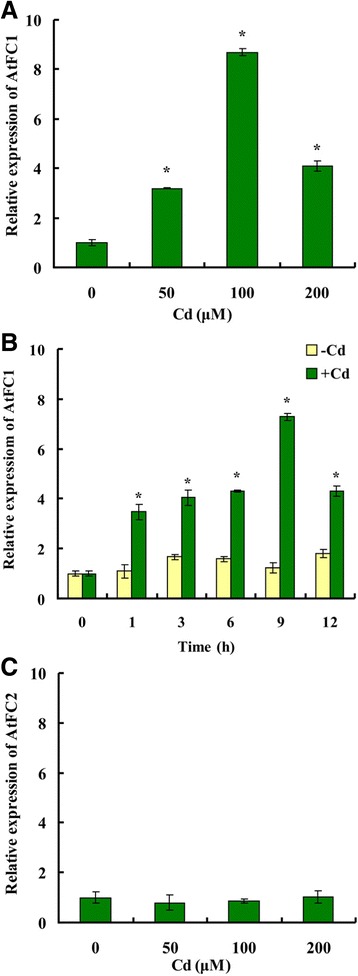
Fig. 1.

Expression pattern of FC-1 and FC-2 in Arabidopsis seedlings exposed to Cd. Three weed-old seedlings (wide-type) cultured in half-strength Hoagland solution were exposed to 0, 50, 100 and 200 μM Cd for 9 h (a, c) or to 100 μM Cd for 0, 1, 3, 6, 9 and 12 h (b). Following treatment, total RNA was extracted. Transcript levels were analyzed by qRT-PCR. Vertical bars represent standard deviation. Asterisks indicate that the mean values are significantly different between the Cd treatment (+Cd) and control (−Cd) (p < 0.05)
