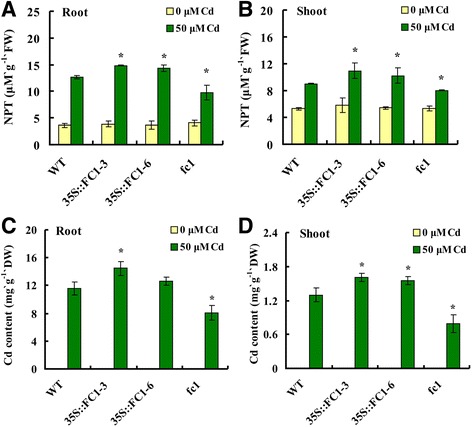
Fig. 4.

NPT and Cd concentrations in shoots and roots of WT, (35S::FC1) and fc1 mutant plants. Seedlings were grown in the half-strength Hoagland solution for 21 d and transferred to the same culture solution with 50 μM Cd for 5 d. a, b: NPT contents. c, d: Cd contents. Vertical bars represent standard deviation. Asterisks indicate that the mean values are significantly different between the transgenic plants/mutants and WT (p < 0.05)
