Figure.

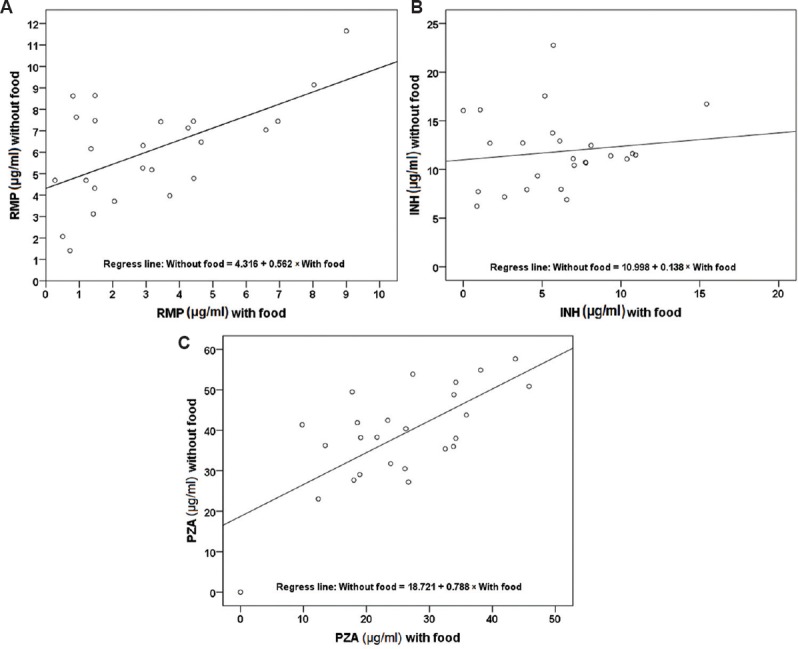
Distribution of two-hour concentrations of rifampicin (RMP) (A), isoniazid (INH) (B) and pyrazinamide (PZA) (C) with and without food (n=25). The diagonal lines indicate the correlation between the points.

Distribution of two-hour concentrations of rifampicin (RMP) (A), isoniazid (INH) (B) and pyrazinamide (PZA) (C) with and without food (n=25). The diagonal lines indicate the correlation between the points.