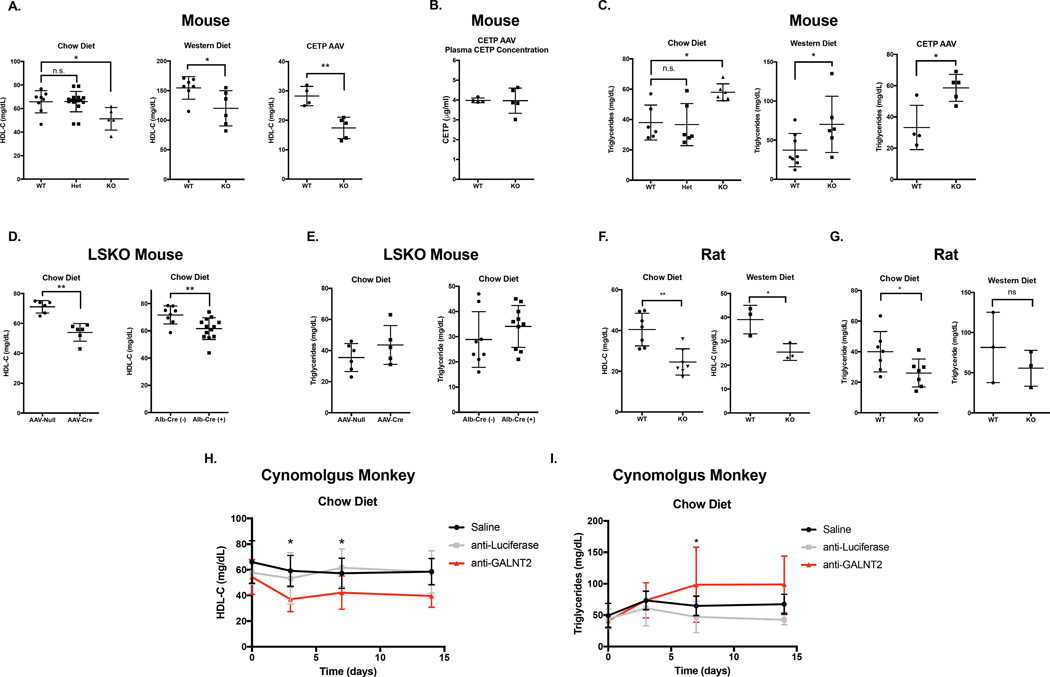
Figure 2. Plasma HDL cholesterol in mammalian models of GALNT2 loss-of-function.
A. Plasma HDL-C after a 4 hour fast from Galnt2 WT, heterozygous (Het), and KO mice fed a chow diet (left), a chow diet after 4 weeks or administration of human CETP AAV (center), or a Western-type diet for 3 weeks (right). B. Plasma CETP concentration after 4 weeks in mice from (A, right). C. Plasma triglycerides in mice from (A). D. Plasma HDL-C from Galnt2 WT vs. liver-specific KO mice generated by AAV-Cre delivery in Galnt2fl/fl mice (left) or crossing Galnt2fl/fl with Alb-Cre transgenic mice (right). E. Plasma triglycerides in mice from (D). F. Plasma HDL-C after fasting for 12–16 hours from Galnt2 WT vs. KO rats fed a chow diet (left) or 6 weeks of Western-type diet (right). G. Plasma triglycerides in rats from (F). H. Plasma HDL-C after overnight fasting in cynomolgus monkeys (cyno) treated with saline, anti-luciferase siRNA or anti-GALNT2 siRNA. I. Plasma triglycerides in cyno monkeys from (H). Data is presented as mean values ± S.D.. * P<0.05, ** P<0.01, Student’s unpaired T-test.

