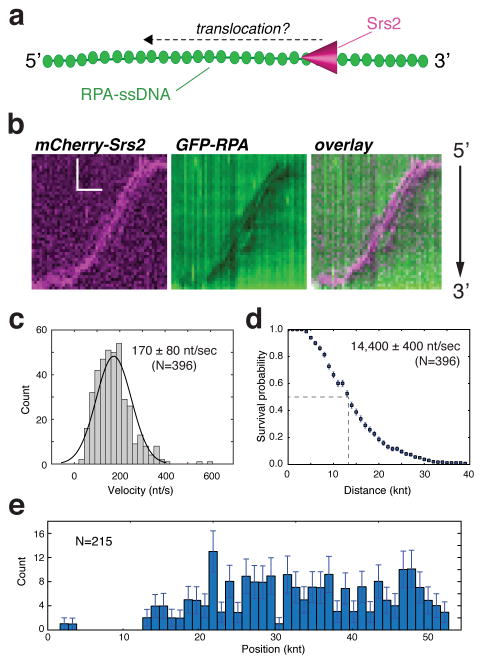
Figure 1. Srs2 translocation on ssDNA molecules bound by S. cerevisiae GFP-RPA.
(a) Schematic depiction of the assay used to visualize mCherry-Srs2 translocation on GFP-RPA-coated ssDNA. (b) Kymographs demonstrating the 3′→5′ movement of mCherry-Srs2 (magenta) along GFP-RPA bound ssDNA (green). The orientation of the ssDNA is indicated, and the images show the mCherry-Srs2 fluorescence signal, the GFP-RPA fluorescence signal, and the overlaid fluorescence signals, as indicated. (c) Velocity distribution and (d) survival probability measurement for mCherry-Srs2 translocating on RPA bound ssDNA; error bars represent s.d. calculated from bootstrapping analysis. The dashed line in (d) highlights the distance at which 50% of the Srs2 complex stop translocating, which we report as processivity values in the text. (e) Distribution of initial Srs2 binding sites; error bars represent s.d. calculated from bootstrapping analysis. The data in (c–e) represent the combined data sets for GFP-Srs2 and mCherry-Srs2 (see Figure S2).

