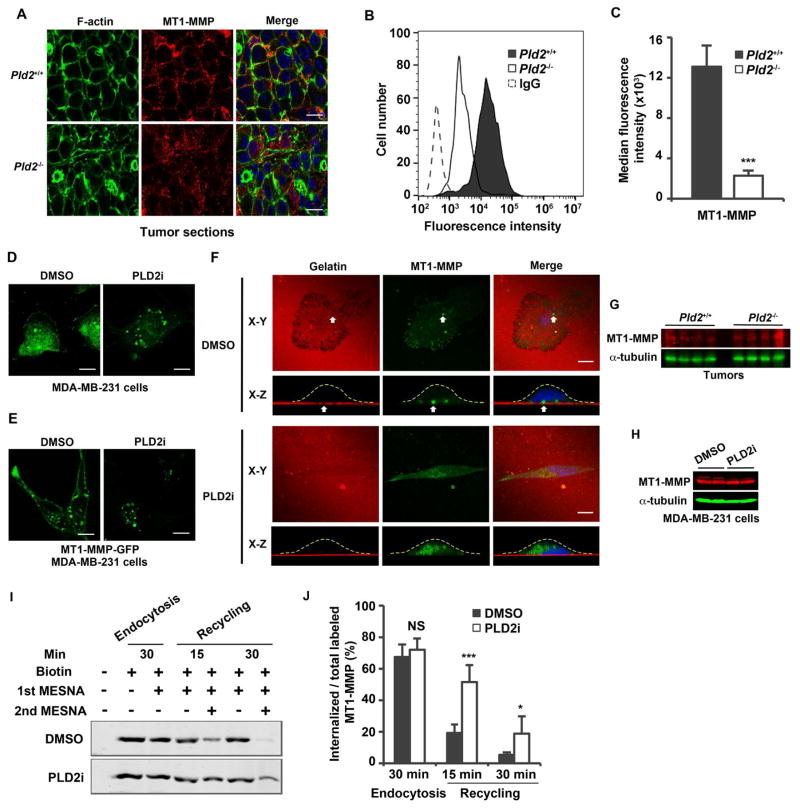
Figure 4.
Inhibition of PLD2 leads to the loss of MT1-MMP plasma membrane localization and accumulation of intracellular vesicles. (A) Immunofluorescent staining of MT1-MMP in cancer cells using cryosections of primary tumors. Pictures are representatives of tumors from 4 mice for each genotype. (B) Histograms of fluorescent intensity analyzed by flow cytometry showing MT1-MMP cell surface expression in primary tumor cells. (C) Statistic results of the median MT1-MMP fluorescence intensity. Background IgG fluorescence was subtracted. n=3. (D and E) Localization of endogenous MT1-MMP (D) or MT1-MMP-GFP (E) in MDA-MB-231 cells treated with DMSO or PLD2 inhibitor (5μM). (F) Localization of MT1-MMP-GFP in MDA-MB-231 cells plated on Alexa 594-labeled gelatin in the presence of DMSO or PLD2 inhibitor (5μM). X-Z images were reconstructed from a series of X-Y confocal images. The dash lines outline cell board in X-Z reconstruction. (G) PLD2 deficiency did not affect MT1-MMP expression in tumors. Protein samples were collected from tumors from 4 individual mice for each genotype. (H) PLD2 inhibitor had no effect on MT1-MMP expression in MDA-MB-231 cells. The control and PLD2 inhibitor treatment were performed in duplicate. (I) PLD2 regulates the recycling of MT1-MMP to the cell surface. Cell surface proteins were labeled with (lane 2–7) or without biotin (lane 1) on ice for 15 min. The biotinylated cells were incubated at 37°C for 30 min to allow endocytosis, then treated with or without MESNA (1st MESNA) on ice to measure intracellular (lane 3) and total (lane 2) labeled proteins, respectively. After internalization, the biotinylated cells were incubated at 37°C for 15 (lanes 4 and 5) or 30 min (lanes 6 and 7) to allow recycling, and then treated with or without MESNA (second) to measure intracellular (lanes 5 and 7) and total (lanes 4 and 6) labeled proteins, respectively. Biotinylated proteins were recovered by streptavidin beads and analyzed by Western blotting using an MT1-MMP antibody. (J) Quantification of results in I. The intracellular labeled MT1-MMP was normalized to total labeled MT1-MMP. n=3. Scale bars = 10 μm. Quantifications are presented as mean ± SD; t-test, *p < 0.05, ***p < 0.001, NS (p> 0.05). See also Figures S2–S4.

