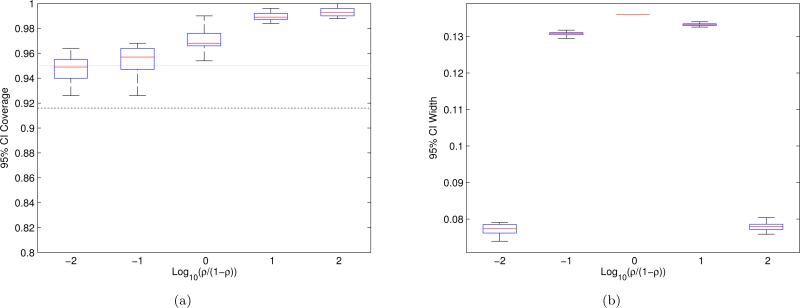
Figure 8.
(a) Coverage, and (b) average widths, of EigenPrism SNR 95% confidence intervals. Experiments used n = 105, p = 5×10⁵, θ2 + σ2 = 104, Bernoulli(0.01) design, and β with 10% non-zero, Gaussian entries. Each boxplot summarizes the (a) coverage and (b) width for 20 different β's, each of which is estimated with 500 simulations. The whiskers of the boxplots extend to the maximum and minimum points. The black dotted line in (a) is the 95% confidence lower-bound for the lowest whisker in each plot assuming all CIs achieve exact coverage, and the grey line shows nominal coverage.

