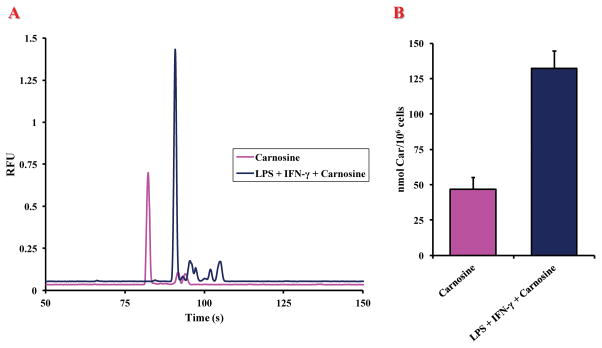
Fig. 5.
(A) Representative electropherograms of cell lysates showing the change in peak area of carnosine for macrophages stimulated with carnosine (purple) and stimulated with LPS + IFN-γ followed by 20 mM carnosine (dark blue). (B) Graph of intracellular concentrations of carnosine in macrophages stimulated with carnosine and of macrophages stimulated with LPS + IFN- γ followed by 20 mM carnosine. Values are the mean of four different experiments. Standard deviations are represented by vertical bars.
*significantly different from resting (p < 0.001)

