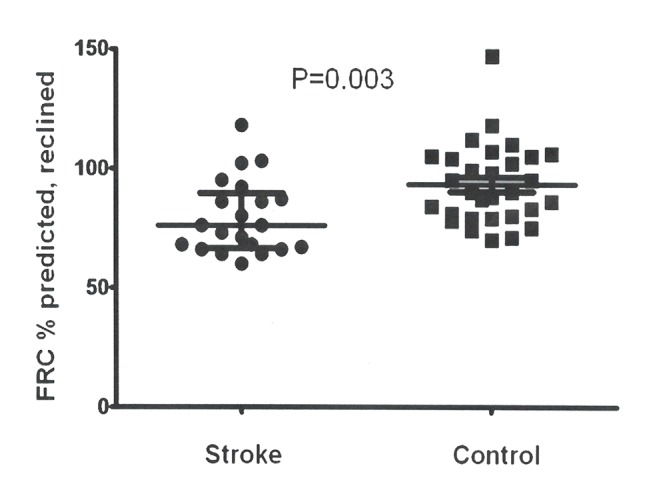
Figure 1.

Comparison of reclined functional residual capacity (FRC) in stroke patients and controls. The figure shows FRC % predicted for 21 patients* and 30 controls. Medians and IQRs are marked with horizontal lines. See table 3 for further information. p Value calculated using a Mann-Whitney U test. *In total, 6 patients of the 27 assessed were unable to tolerate two FRC measurements in the reclined position.
