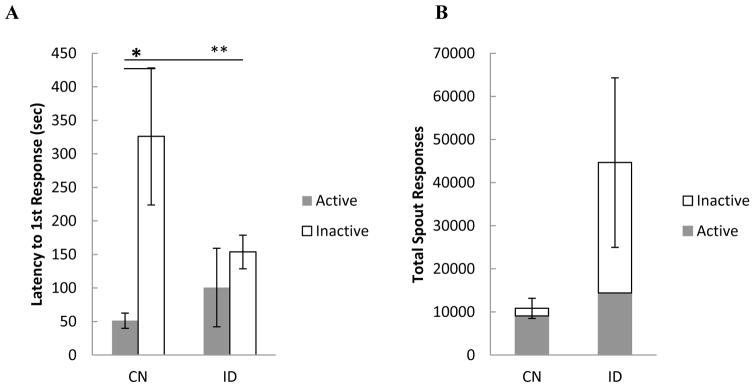
Figure 5.
A) Mean (+/− SEM) latency (sec) to make the 1st response on the active and the inactive spout by control (CN) rats and by rats with a history of iron deficiency (ID) averaged across 22 fixed ratio trials. B) Mean (+/− SEM) total responses on the active plus the inactive spout for CN and ID rats averaged across 22 fixed ratio trials.

