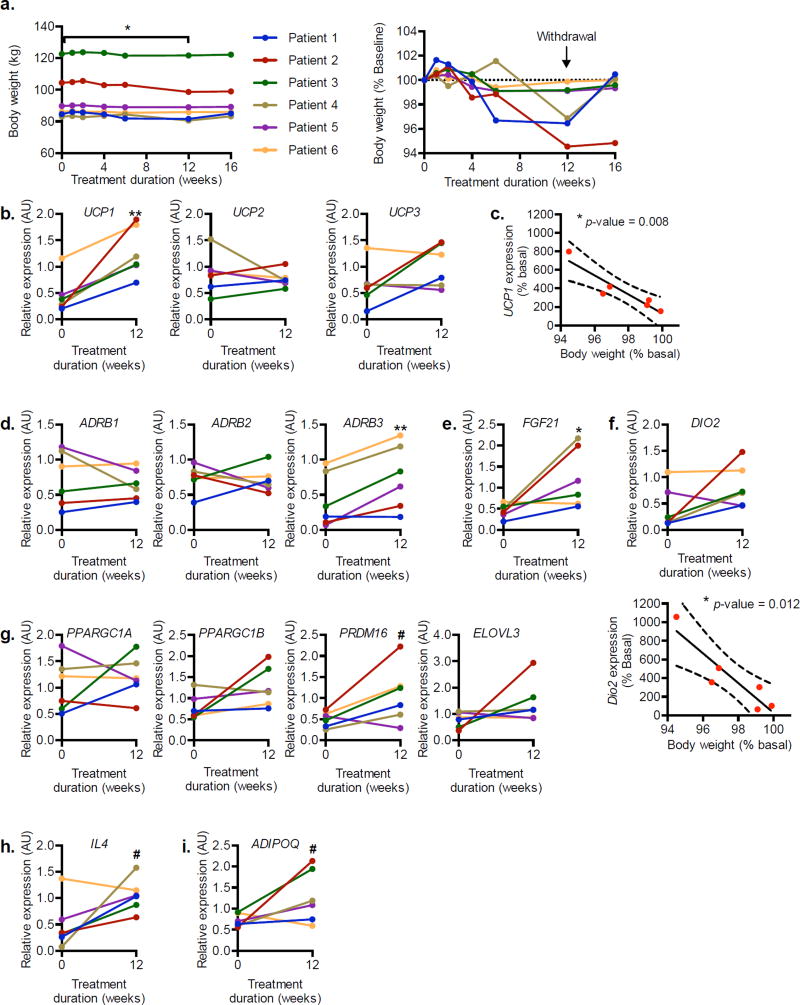
Figure 2. Weight loss and gene expression changes in the open label study subjects.
a) Body weight (left panel) and body weight represented as percentage of baseline body weight (right panel) during 12-week treatment and 4-week washout observation period. b) Relative expression of UCP family of genes encoding mitochondrial inner membrane protein. c) Correlation of relative UCP1 expression to weight loss after 12 weeks of treatment. d) Relative expression of ADRB family of genes encoding β-adrenergic receptors. Relative expression of beige fat markers: (e) FGF21, (f) DIO2, (g) PPARGC1A, PPARGC1B, PRDM16, and ELOVL3. f) Correlation of DIO2 expression and weight loss (bottom panel). h) Relative expression of IL4. i) Relative expression of ADIPOQ, the gene encoding adiponectin. n = 6. ** indicates p-value ≤ 0.01; * indicates p-value ≤ 0.05; # indicates P-value ≤ 0.10 (two-tailed paired t-test). c, f Pearson’s correlation with 95% CI. AU, arbitrary unit.

