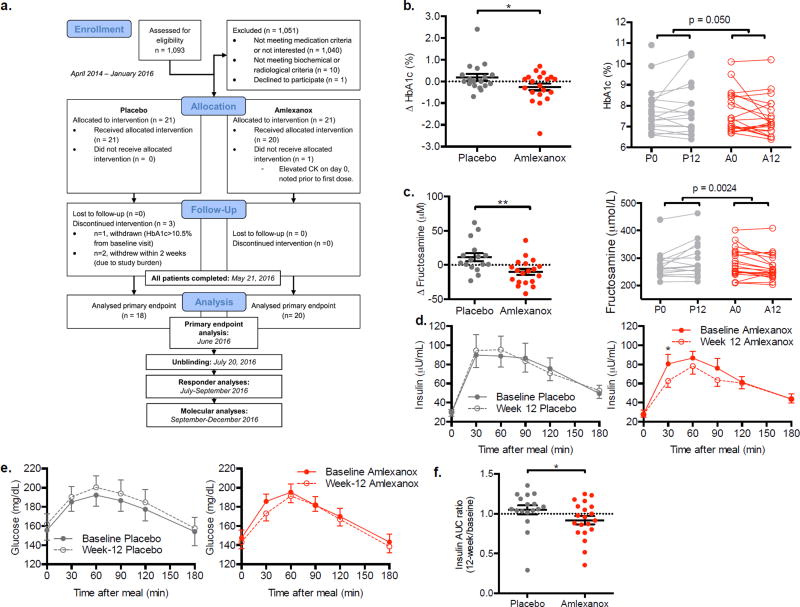
Figure 3. Measures of glycemic control in the double blind, placebo-controlled trial.
a) Consort diagram: Schematic of randomized double blind placebo-controlled trial. For details on evaluable n of secondary and exploratory end point analyses, refer to Table S2. Difference from baseline in b) Hemoglobin A1c and (c) fructosamine in the placebo- and amlexanox-treated patients left panels; right panels display baseline and 12-week values for each patient connected with a line. d) Insulin and (e) glucose during the mixed meal test. f) Insulin ratio (week 12 divided by baseline area under the curve for insulin measured during the mixed meal test). b: n = 18 placebo, n = 20 amlexanox; c–f: n = 17 placebo, n = 20 amlexanox (n = 7 A–R). ** indicates p-value ≤ 0.01 and * indicates p-value ≤ 0.05 (two tailed t-test, b, c, e unpaired, d paired). Data presented as individual data and mean ± s.e.m. (b, c, f) or mean ± s.e.m. only (d, e). See also Figure S2–S4, and Table S3 and S4.

