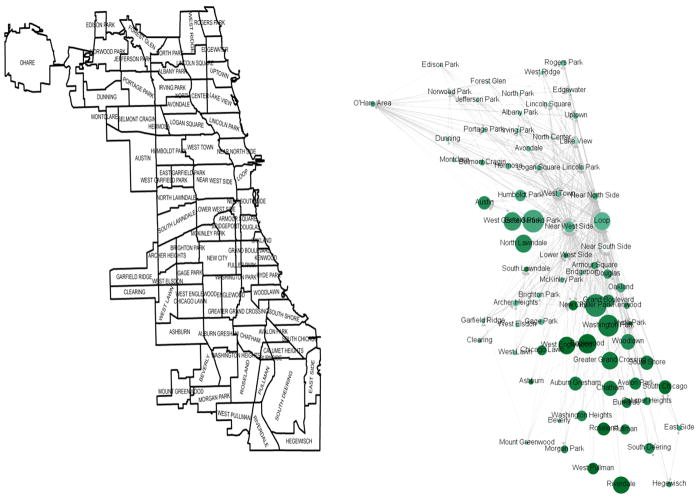
Fig. 1.
Network isolation and violence among Chicago’s neighborhoods. Leftmost map: Geographic map of all 77 neighborhoods’ (community areas) boundaries. Rightmost map: Commuting network (binary ties) among neighborhoods (represented by nodes, circles of various size, positioned at neighborhoods’ geographic centroid). The more violent the neighborhood, the larger size of the node. The more isolated the neighborhood (inverse out-degree), the darker the color.

