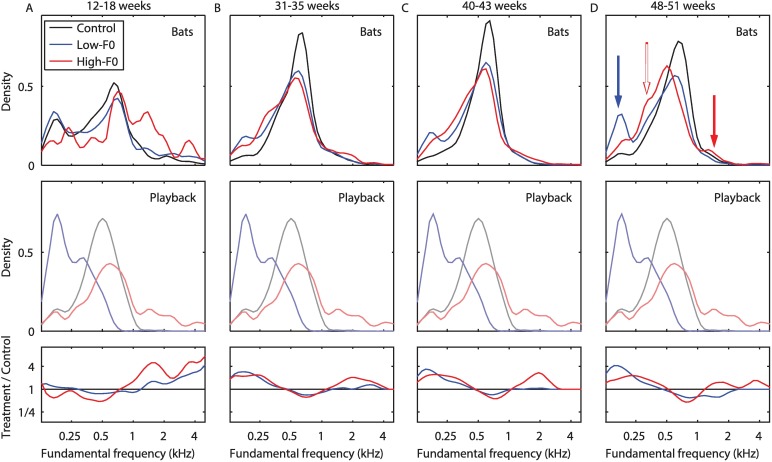
Fig 3. The playbacks direct the dialect formation.
The distribution of F0 usage by the 3 groups (top panels): control (black), Low-F0 (blue), and High-F0 (red). The 4 recording sessions are presented as 4 columns: (A) 12–18 weeks, (B) 31–35 weeks, (C) 40–43 weeks, and (D) 48–51 weeks. The presented distribution is the average for all pups in the group (see S2 Fig for the usage distribution of each pup separately). For comparison, the middle panels depict the F0 distribution in the playback of each group, as depicted in Fig 1F (the same for all recording sessions). The lower panels show the ratio of each distribution (in the upper panels) to that of the control group (in log-scale). The filled arrows in the upper panel of (D) show the main effect of the playback in each group, while the empty arrow shows an unexpected increase in the Low-F0 usage by the High-F0 group. Numeric data are given in S1 Data. F0, fundamental frequency.

