
Fig 7. Cells activated in non-polarizing conditions in vitro from other mouse strains and humans show co-expression of T-bet and GATA-3.
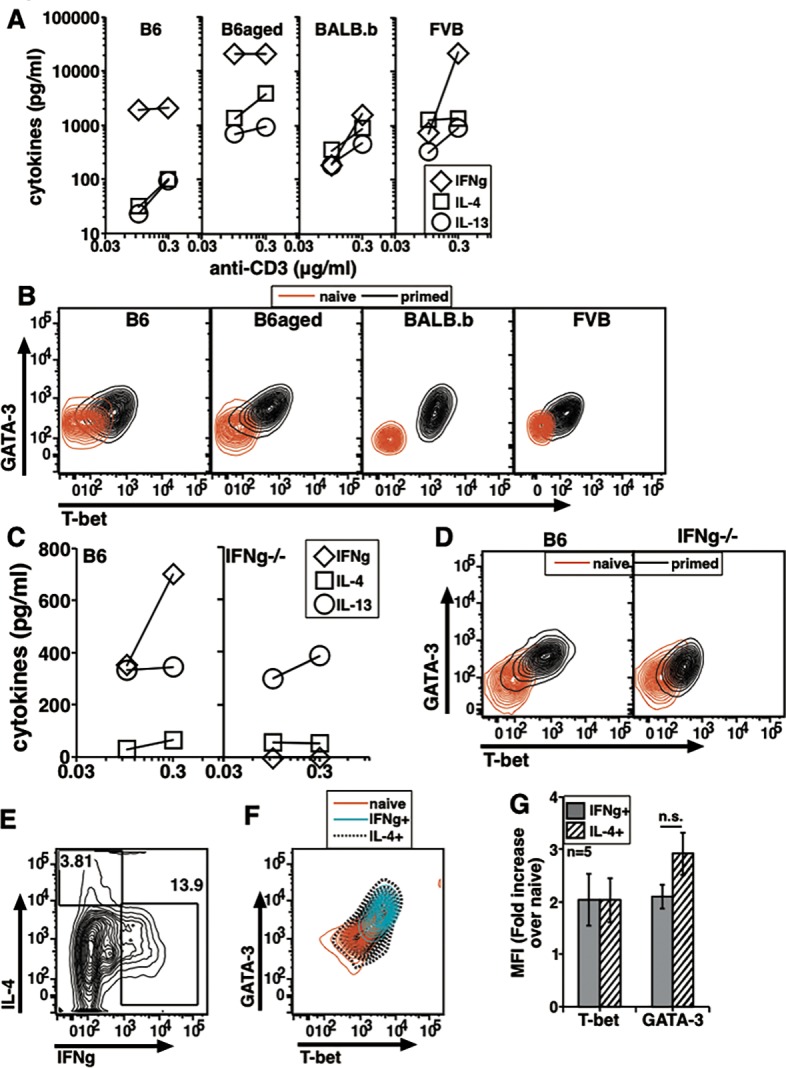
(A) Dose response curve from one experiment to show secreted cytokine levels in primed and recalled cells from B6, B6aged, BALB.b and FVB. Data representative of 3 independent experiments. (B) Representative two-color plots of T-bet and GATA-3 expression in naive and primed cells as overlays. Data representative of 5 experiments. (C) Dose response curve from one experiment to show secreted cytokine levels in primed and recalled cells from B6 and IFNg-/- mice. Data representative of 3 independent experiments. (D) A representative two-color plot of T-bet and GATA-3 expression in naive and primed cells from B6 and IFNg-/- mice as overlays. Data representative of 3 experiments. (E) A representative plot to show intracellular cytokine staining in P+I treated 72 h primed human NCD4T cells. (F) Two color plots of in vitro primed human CD4 cells to show T-bet and GATA-3 expression in indicated populations as overlays. (G) Data from independent donors compiled to show relative T-bet and GATA-3 MFI increases over naive cells in IFNg+ and IL-4+ human CD4 T cells.