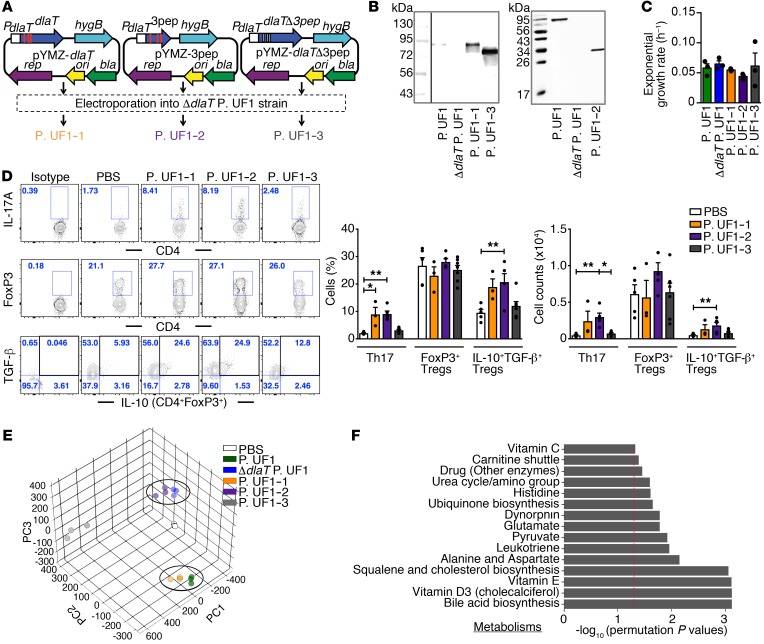
Figure 6. Restoring Th17 cell differentiation by complementation of ΔdlaT P. UF1 with dlaT.
(A) Complementation of ΔdlaT P. UF1 with the dlaT gene (P. UF1–1, orange), the 3 dlaT peptides (P. UF1–2, purple), and the dlaT gene minus the 3 peptides (P. UF1–3, gray). (B) Western blot analysis of DlaT expression and the 3 peptides in cell lysates of the complemented strains using polyclonal anti-DlaT antibodies. (C) Exponential growth rate of the complemented strains in MRS-lactate medium (n = 3 samples/group). (D) GF mice were gavaged with P. UF1–1, P. UF1–2, P. UF1–3 (109 CFU/mouse), or PBS on days 0, 3, 6, and 9. Two weeks later, induced colonic immune responses were analyzed. Representative data of flow plots, percentages, and total cell counts of Th17 cells, CD4+FoxP3+ Tregs, and IL-10+TGF-β+ Tregs. (E and F) Fecal sample metabolomic analyses of GF mice gavaged with aforementioned complemented strains or PBS. PCA of fecal sample metabolites (E) and comparison of significant pathways between P. UF1: P. UF1–1 and ΔdlaT P. UF1: P. UF1–2 (F). Red dashed line shows permutation P value of 0.05. Data are pooled from 2 independent experiments (n = 3–7 mice/group, D) or are representative of 1 (n = 3 mice/group, E and F) or 3 (B and C) independent experiments. Error bars indicate mean ± SEM. *P < 0.05; **P < 0.01, ANOVA plus Tukey’s post test (C) or Kruskal-Wallis plus Dunn’s post test (D).

