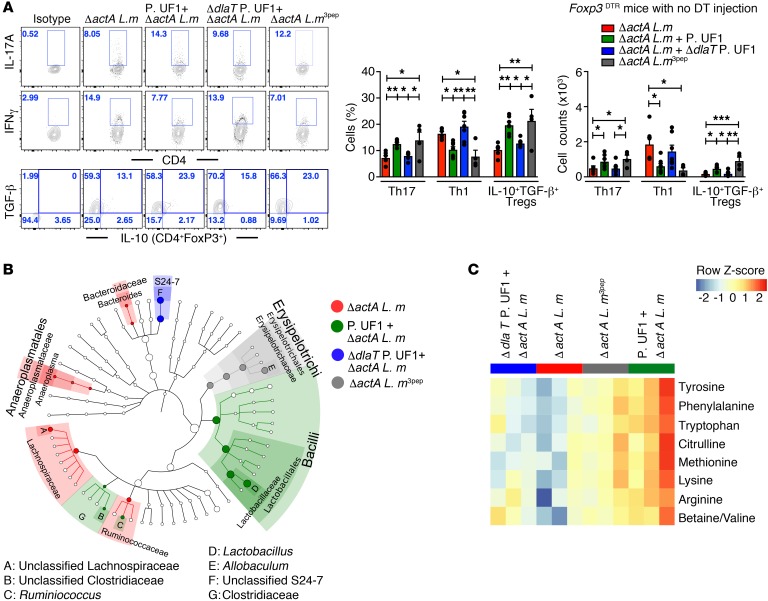
Figure 7. Regulation of colonic immunity by P. UF1 during ΔactA L. m infection.
(A) B6.129(Cg)-Foxp3tm3(DTR/GFP)Ayr/J (Foxp3DTR) mice with no DT injection were gavaged with PBS (red), P. UF1 (green), or ΔdlaT P. UF1 (blue) and orally infected with ΔactA L. m. One group of mice was orally infected with ΔactA L. m3pep (gray). Representative data of flow plots, percentages, and total counts of colonic Th17 cells, Th1 cells, and FoxP3+IL-10+TGF-β+ Tregs. (B) Taxonomic cladogram of fecal microbiota from experimental groups (P < 0.05, Kruskal-Wallis test) from groups of C57BL/6 mice gavaged with P. UF1 or dlaT P. UF1 and orally infected with ΔactA L. m as described in A. (C) Heatmap of selected fecal metabolites (P < 0.05, 1-way ANOVA) from mouse groups as described in A. Data are pooled from 2 independent experiments (n = 4–7 mice/group, A) or representative of 2 independent experiments (n = 3 mice/group, B and C). Error bars indicate mean ± SEM. P < 0.05; *P < 0.05; **P < 0.01; ***P < 0.001, ANOVA plus Tukey’s post test (A).

