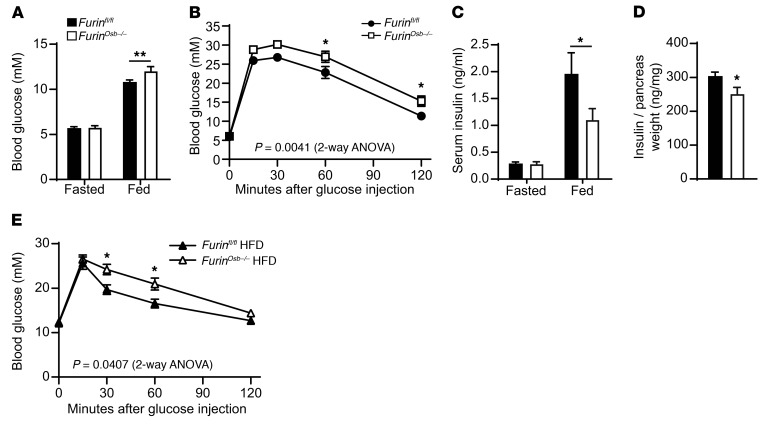
Figure 8. Reduced glucose tolerance in Furinosb–/– mice.
(A) Fasting and fed blood glucose levels in 9-month-old Furinfl/fl (n = 12) and Furinosb–/– (n = 10) mice. (B) GTT results for 9-month-old Furinfl/fl (n = 21) and Furinosb–/– (n = 16) mice. Mice were fasted for 16 hours and injected i.p. with 2 g/kg glucose. (C) Fasting and fed serum insulin levels in 9-month-old Furinfl/fl (n = 12) and Furinosb–/– (n = 10) mice. (D) Pancreas insulin content in 9-month-old Furinfl/fl (n = 10) and Furinosb–/– (n = 10) mice. (E) GTT results for 4-month-old Furinfl/fl (n = 8) and Furinosb–/– (n = 7) mice after 10 weeks on a high-fat, high-sucrose diet (HFD). Mice were fasted for 6 hours and then injected i.p. with 1 g/kg glucose. Metabolic assessments were performed on male mice fed a normal chow diet (A–D) or a HFD (E). Results represent the mean ± SEM. *P < 0.05 and **P < 0.01, by 2-way ANOVA for repeated measurements with Bonferroni’s multiple comparisons test (A–C and E) or by unpaired, 2-tailed Student’s t test (D).

