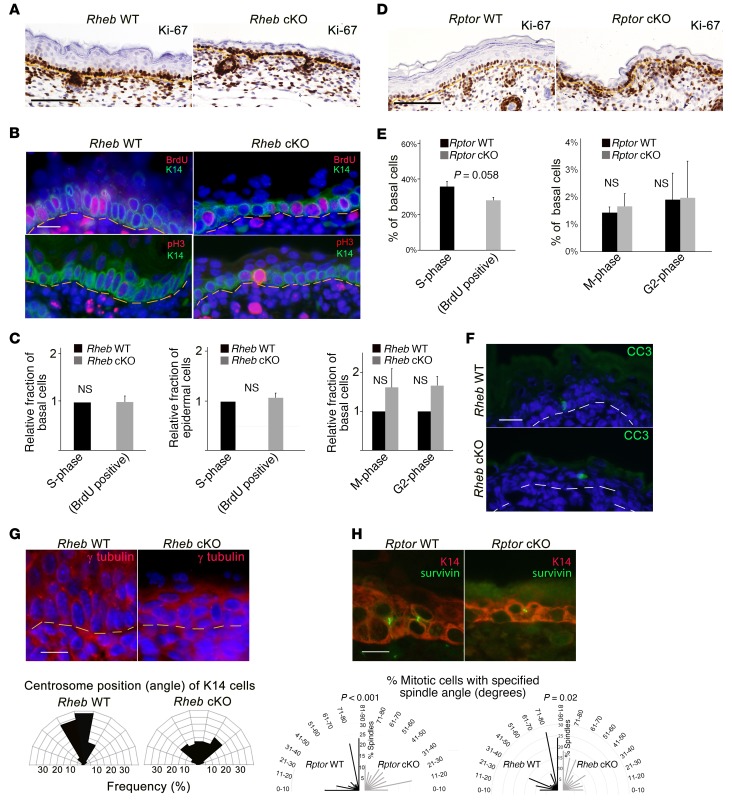
Figure 2. mTORC1 loss of function does not significantly alter epidermal proliferation or apoptosis, but is associated with abnormal mitotic polarization.
(A) Ki-67 immunohistochemistry in E18.5 Rheb WT and cKO epidermis. Scale bar: 75 μm. (B) BrdU labeling detected by immunofluorescence (top panels) in E18.5 WT or Rheb-cKO epidermis. Scale bar: 60 μm. Immunofluorescence for phospho–histone H3 (pH3), an M-phase marker (bottom panels), in E18.5 WT and Rheb-cKO epidermis. Scale bar: 60 μm. (C) Mean proportion of basal or total epidermal BrdU-labeled (r = 3, n > 20, ×200 fields each) or pH3-positive cells (r = 3, n > 33, ×200 fields each) in WT versus Rheb-cKO E18.5 epidermis (at least 15 ×200 fields quantified for each; error bars represent SEM; P values indicated are by Student’s t test). (D) Ki-67 immunohistochemistry in E18.5 Rptor WT or cKO epidermis. Scale bar: 75 μm. (E) Mean proportion of basal cells labeled with BrdU (left panel) or pH3 (right panel) in WT versus Rptor cKO E18.5 epidermis (r = 8; at least 20 ×200 fields were quantified for each; error bars represent SEM; P values indicated are by Student’s t test). (F) Representative immunofluorescence for cleaved caspase-3 (CC3) in WT and Rheb-cKO E18.5 epidermis. Scale bar: 60 μm. (G) Immunofluorescence for γ-tubulin in WT and Rheb-cKO E18.5 epidermis (top). Scale bar: 60 μm. Angles between centrosomal axis and plane of basement membrane in Rheb WT versus cKO cells (bottom) (r = 3; minimum of 15 ×200 fields quantified for each). (H) Representative immunofluorescence for the spindle midbody marker survivin (green) and K14 (red) in WT versus Rptor-cKO E17.5 epidermis (top panel). Radial histogram of the angle of basal cell division in WT (r = 8, n = 128) versus Rptor-cKO (r = 9, n = 61) (bottom panel, left) or WT (r = 4, n = 77) versus Rheb-cKO (r = 4, n = 66) (bottom panel, right) (P values indicated by χ2 test).

