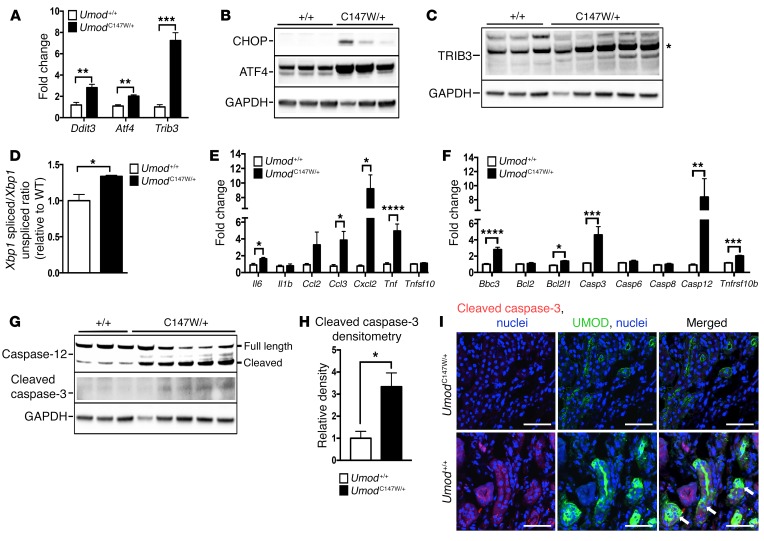
Figure 3. UmodC147W/+ kidneys activate ER stress, innate immune response, and apoptotic pathways.
(A) Quantitative PCR of whole-kidney tissue at 24 weeks for key ER stress response genes. (B) Western blot of whole-kidney tissue to detect key ER stress mediators. (C) Western blot of whole-kidney tissue to detect TRIB3. Note: The band with the correct size for the predicted molecular weight is marked with a single asterisk. (D) Quantitative PCR of cDNA from whole-kidney tissue for the ratio of spliced to unspliced Xbp1. (E) Quantitative PCR of cDNA from whole-kidney tissue for relevant innate immune mediators. (F) Quantitative PCR of cDNA from whole-kidney tissue for apoptotic mediators. (G) Western blot of whole-kidney tissue to detect cleaved caspase-3 and total caspase-12 (cleaved band runs below the full-length band). (H) Densitometric analysis for cleaved caspase-3 normalized to GAPDH. (I) Immunofluorescence images of kidney sections (7-μm-thick) labeled for active cleaved caspase-3 (red) and UMOD (green). Arrows indicate tubules positive for active caspase-3 and UMOD. Scale bars: 50 μm (original magnification, ×40). Data represent the mean ± SEM. *P < 0.05, **P < 0.01, ***P < 0.001, and ****P < 0.0001, by 2-tailed Student’s t test. n = 6–8 per group.

