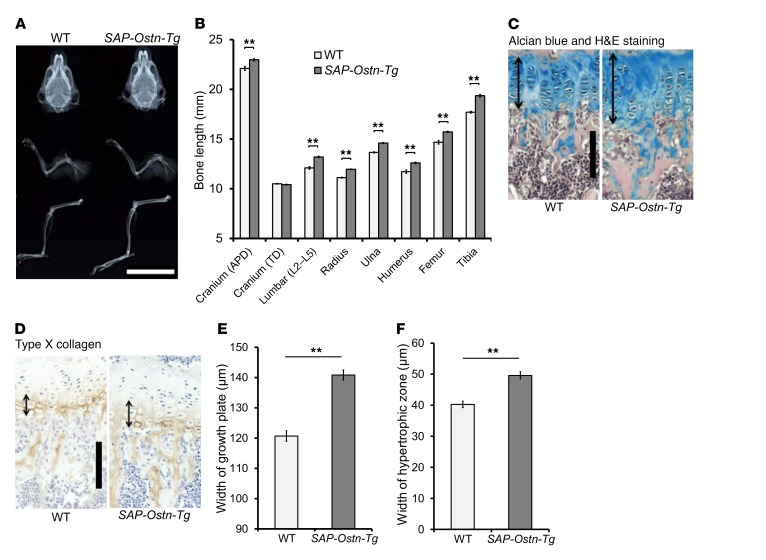
Figure 2. Skeletal phenotypes of SAP-Ostn-Tg mice.
(A) Radiographs of the skulls, forelimbs, and hind limbs of WT and SAP-Ostn-Tg mice at the age of 10 weeks. SAP-Ostn-Tg mice showed skeletal overgrowth in each bone compared with WT mice. Scale bar: 2 cm. (B) Bone lengths of WT and SAP-Ostn-Tg mice at the age of 10 weeks measured on soft x-ray films. Lengths of the skull, lumbar spine, radius, ulna, humerus, femur, and tibia were significantly larger in SAP-Ostn-Tg mice than in WT mice. Width of the skull was not different between the 2 genotypes. APD, anteroposterior diameter; TD, transverse diameter. n = 5 each, for each bone length in WT and SAP-Ostn-Tg mice. (C and D) Histological pictures of the growth plates of Alcian blue and H&E staining (C) and immunohistochemical staining for type X collagen (D). Left panels show the growth plates of 10-week-old WT mice, and right panels show those of 10-week-old SAP-Ostn-Tg mice. Arrows indicate the widths of growth plates (C) and hypertrophic chondrocyte layers (D). Scale bars in C and D: 100 μm. (E and F) Width of growth plate (E) and hypertrophic zone (F) of WT and SAP-Ostn-Tg mice at the age of 10 weeks measured on the pictures. SAP-Ostn-Tg mice had significantly thicker growth plates and hypertrophic chondrocyte layers than WT mice. n = 5 each. **P < 0.01, by Student’s t test.

