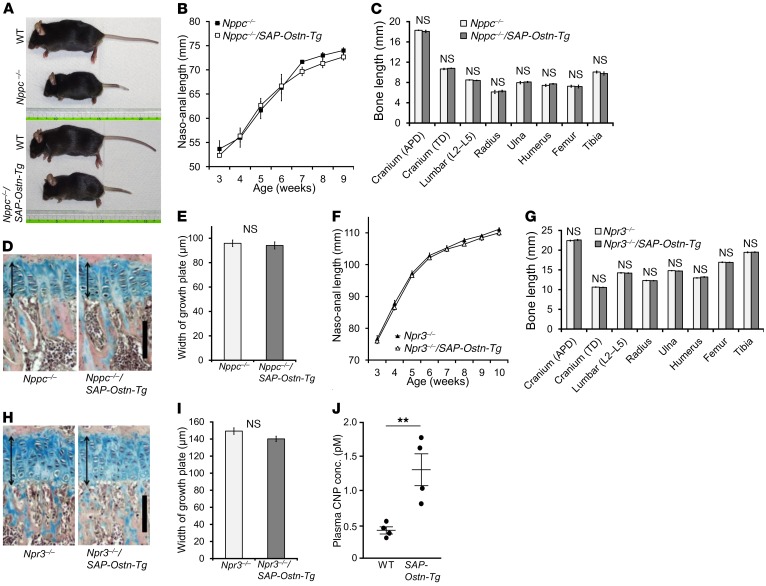
Figure 4. Mechanistic analyses of skeletal overgrowth in SAP-Ostn-Tg mice.
(A) Gross appearance of Nppc–/– and Nppc–/–/SAP-Ostn-Tg mice. Top panel shows 9-week-old WT and Nppc–/– mice, and bottom panel shows 9-week-old WT and Nppc–/–/SAP-Ostn-Tg mice. (B) Growth curves of naso-anal length of Nppc–/– (filled squares) and Nppc–/–/SAP-Ostn-Tg (open squares) mice measured every week from the ages of 3 to 9 weeks. n = 3 each. (C) Bone lengths of 9-week-old Nppc–/– and Nppc–/–/SAP-Ostn-Tg mice. n = 3 each, for each bone length in Nppc–/– and Nppc–/–/SAP-Ostn-Tg mice. (D) Histological photographs of the tibial growth plates of Alcian blue and H&E staining of 9-week-old Nppc–/– and Nppc–/–/SAP-Ostn-Tg mice. Arrows indicate the widths of growth plates. Scale bar: 100 μm. (E) The widths of the tibial growth plates of 9-week-old Nppc–/– and Nppc–/–/SAP-Ostn-Tg mice. n = 3 each. (F) Growth curves of naso-anal length of Npr3–/– (filled triangles) and Npr3–/–/SAP-Ostn-Tg (open triangles) mice measured every week from the ages of 3 to 10 weeks. n = 7 each. (G) Bone lengths of 10-week-old Npr3–/– and Npr3–/–/SAP-Ostn-Tg mice. n = 6 each, for each bone length in Npr3–/– and Npr3–/–/SAP-Ostn-Tg mice. (H) Histological images of the tibial growth plates of Alcian blue and H&E staining of 10-week-old Npr3–/– and Npr3–/–/SAP-Ostn-Tg mice. Arrows indicate the widths of growth plates. Scale bar: 100 μm. (I) Widths of the tibial growth plates of 10-week-old Npr3–/– and Npr3–/–/SAP-Ostn-Tg mice. n = 3 each. (J) Plasma CNP concentrations of 6-week-old WT and SAP-Ostn-Tg mice. n = 4 each. **P < 0.01, by Student’s t test.

