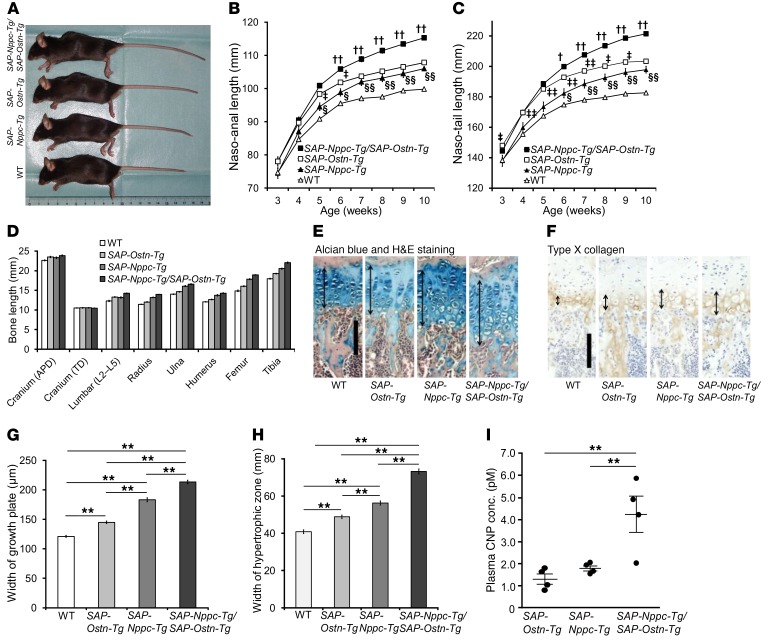
Figure 6. Additive effect of CNP and OSTN on the skeletal growth in double-transgenic mice.
(A) Gross appearance of 10-week-old WT, SAP-Nppc-Tg, SAP-Ostn-Tg, and SAP-Nppc-Tg/SAP-Ostn-Tg mice. SAP-Nppc-Tg/SAP-Ostn-Tg mice were longer than SAP-Nppc-Tg and SAP-Ostn-Tg mice. (B and C) Growth curves based on naso-anal (B) and naso-tail length (C) of WT (open triangles), SAP-Nppc-Tg (filled triangles), SAP-Ostn-Tg (open squares), and SAP-Nppc-Tg/SAP-Ostn-Tg (filled squares) mice measured every week from the ages of 3 to 10 weeks. n = 6, 6, 6, and 7 in WT, SAP-Nppc-Tg, SAP-Ostn-Tg, and SAP-Nppc-Tg/SAP-Ostn-Tg mice, respectively. †P < 0.05, ††P < 0.01 vs. SAP-Ostn-Tg mice; ‡P < 0.05, ‡‡P < 0.01 vs. SAP-Nppc-Tg mice; §P < 0.05, §§P < 0.01 vs. WT mice. One-way ANOVA followed by Tukey-Kramer test was used for statistical analysis. (D) Bone lengths of 10-week-old WT, SAP-Nppc-Tg, SAP-Ostn-Tg, and SAP-Nppc-Tg/SAP-Ostn-Tg mice. n = 6, 6, 6, and 7 in WT, SAP-Nppc-Tg, SAP-Ostn-Tg, and SAP-Nppc-Tg/SAP-Ostn-Tg mice, respectively. Statistical differences between genotypes are summarized in Table 1. (E and F) Histological pictures of the growth plates of 10-week-old mice. Alcian blue and H&E staining (E) and immunohistochemical staining for type X collagen (F) are shown. Arrows indicate the widths of growth plates (E) and hypertrophic chondrocyte layers (F). Scale bars in E and F: 100 μm. (G and H) Widths of growth plates (G) and hypertrophic zone (H) of 10-week-old mice. n = 6, 6, 6, and 7 in WT, SAP-Nppc-Tg, SAP-Ostn-Tg, and SAP-Nppc-Tg/SAP-Ostn-Tg mice, respectively. (I) Plasma CNP concentrations in 6-week-old SAP-Ostn-Tg, SAP-Nppc-Tg, and SAP-Nppc-Tg/SAP-Ostn-Tg mice. There was no significant difference in plasma CNP levels between SAP-Ostn-Tg and SAP-Nppc-Tg mice. SAP-Nppc-Tg/SAP-Ostn-Tg mice had significantly higher blood CNP levels than SAP-Ostn-Tg and SAP-Nppc-Tg mice. n = 4 each. **P < 0.01, by 1-way ANOVA followed by Tukey-Kramer test.

