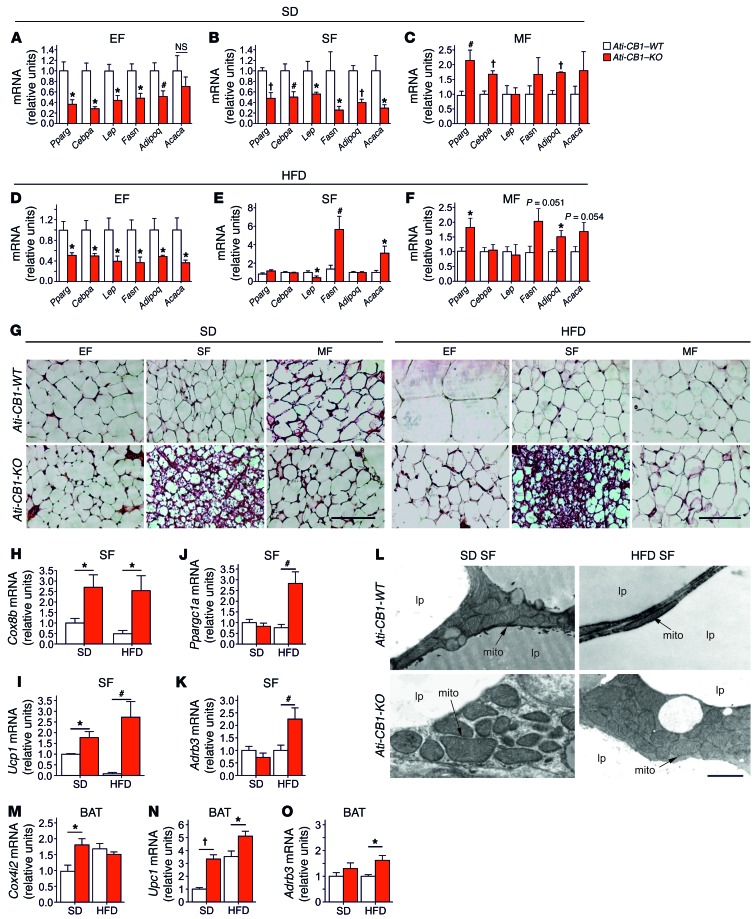
Figure 2. CB1-dependent gene expression profile in adipocytes is depot specific.
(A–F) Gene expression analysis (relative units) of Pparg, Cebpa, Lep, Fasn, Adipoq, and Acaca in EF, SF, and MF from Ati-CB1–WT and Ati-CB1–KO on SD (WT, n = 5–9; KO, n = 5–8), and HFD (WT, n = 5–8; KO, n = 5–6). (G) Representative images of EF, SF, and MF from Ati-CB1–WT and Ati-CB1–KO on both SD and HFD. H&E staining. Scale bars: 100 μm. (H–K) Gene expression analysis (relative units) of Cox8b, Ucp1, Ppargc1a, and Adrb3 in SF from Ati-CB1–WT (n = 4–7) and Ati-CB1–KO (n = 4–7) on both SD and HFD. (L) Electron microscopy of SF from Ati-CB1–WT and Ati-CB1–KO on both SD and HFD. Scale bar: 1 μm. mito, mitochondrium; lp, lipid droplet. (M–O) Gene expression analysis (relative units) of Cox4i2, Ucp1, and Adrb3 in BAT from Ati-CB1–WT (n = 6) and Ati-CB1–KO (n = 6–8) on both SD and HFD. Data are shown as mean ± SEM. *P < 0.05; #P < 0.01; †P < 0.001 vs. WT, Student’s t test.

