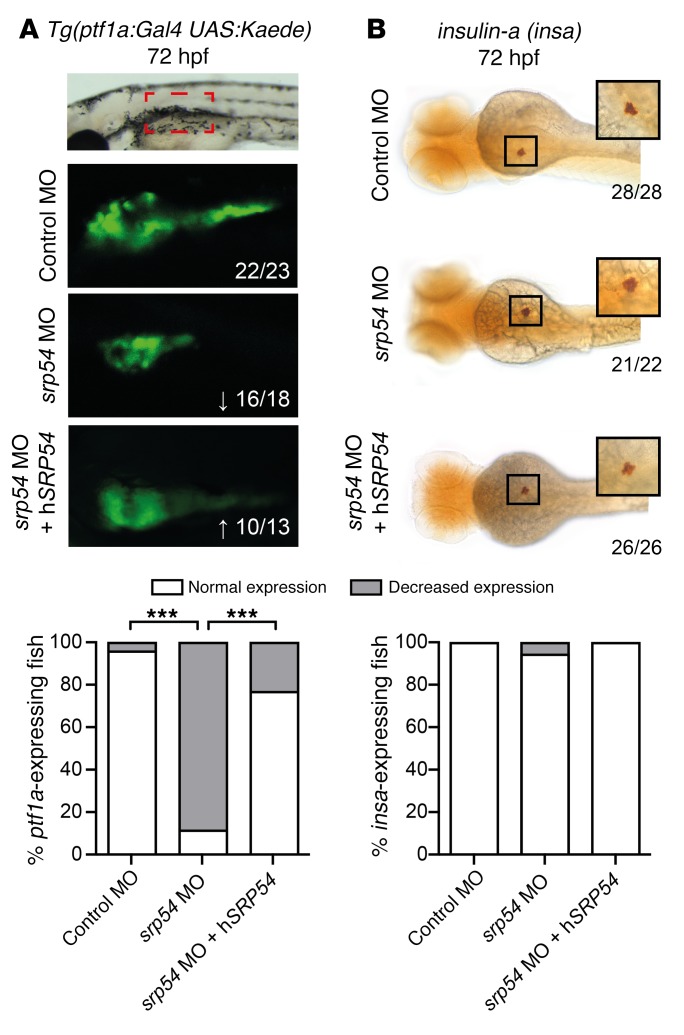
Figure 6. Effects of srp54 gene knockdown on pancreas development in zebrafish embryos.
(A) Confocal images of control-injected, MO-injected, and MO plus 100 pg hSRP54 mRNA–injected transgenic Tg(ptf1a:Gal4 UAS:Kaede) embryos at 72 hpf. Lateral views are shown, with anterior to the left, dorsal up. Arrows indicate downregulation (↓) or rescued expression (↑) for each gene. The red boxed area corresponds to 300 µm (confocal images were taken with a ×10 objective). Original magnification, ×3, for the images below, which show enlarged views of the red boxed area. (B) WISH of insa at 72 hpf in control-injected, MO-injected and MO plus 100 pg hSRP54 mRNA–injected embryos. Dorsal views are shown, with anterior to the left. Shown are representative images from 3 biological replicate experiments with 4 or more embryos per group for each individual biological replicate experiment. Embryo size depicted: 1.75 mm (whole embryo size is 3.5 mm); original magnification of insets, ×2 (images were taken with a ×5 objective on a Leica DM 2000 LED microscope). The graphs below each panel in A and B display the percentages of embryos with normal versus decreased expression in all embryos analyzed across the biological replicates. Numbers indicate the amount of embryos with the respective phenotype/total number of embryos analyzed. ***P < 0.001, by Fisher’s exact test.

