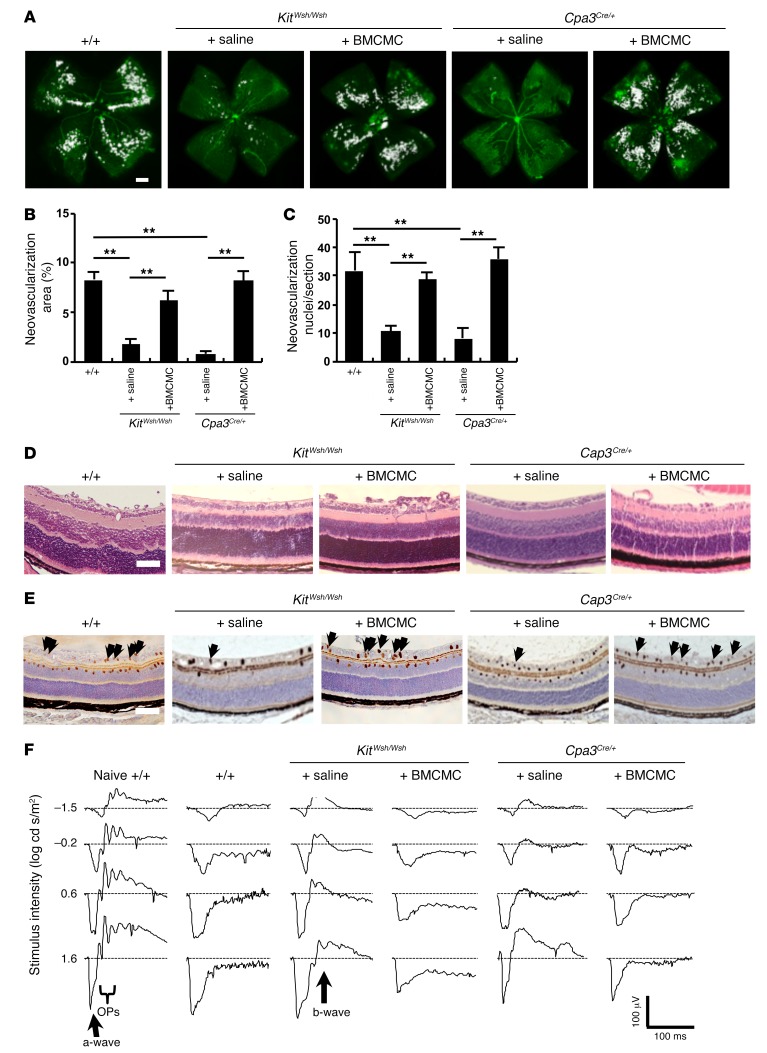
Figure 2. Injection of mast cells induced the formation of neovascular tufts in mast cell–deficient mice.
(A and B) BMCMC but not saline treatment induced the formation of new abnormal blood vessels (white areas) in mast cell–deficient mice with OIR on P17. n = 8 in each group. **P < 0.01 versus saline-injected mast cell–deficient mice, 1-way ANOVA with Tukey’s test. (C) Retinal neovascularization was quantified on P17 by counting the number of neovascular nuclei extending into the vitreous after H&E staining. The number of neovascular nuclei in BMCMC-injected mast cell–deficient pups was comparable to that in WT mice. n = 8 in each group. **P < 0.01 versus saline-injected mast cell–deficient mice, 1-way ANOVA with Tukey’s test. (D and E) Cross-sectional analysis of retinas was performed by H&E (D) or PECAM-1 (E) staining of formalin-fixed paraffin-embedded sections. Arrows indicate endothelial cells that have penetrated into the vitreous space. Results are representative of 3 independent experiments. (F) Normal ERG responses on P19 were seen in age-matched naive WT and saline-injected mast cell–deficient mice, but not in WT or BMCMC-injected mast cell–deficient mice. Scale bars: 500 μm (A); 100 μm (D and E). Results are shown as mean ± SEM of values determined from 3 to 4 independent experiments (B and C).

