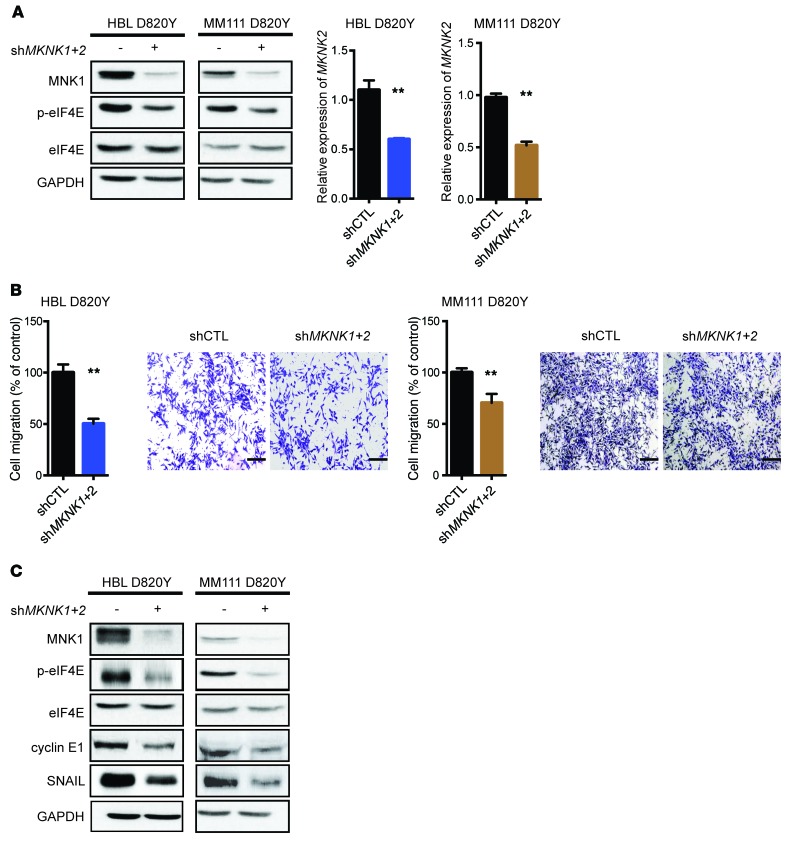
Figure 2. MNK1/2 knockdown in HBL cells suppresses cell migration and the expression of cyclin E1 and SNAIL.
(A) Western blot analysis of MNK1, p-eIF4E, and eIF4E in HBL or MM111 cells expressing shCTL and shMKNK1+2 (left). RT-qPCR was performed to examine the expression level of MKNK2 mRNA in HBL and MM111 cells expressing shCTL and shMKNK1+2 (right). (B) Cell migration was assessed by Transwell assay in shCTL versus shMKNK1+2 HBL and MM111 cells after 48 hours. Representative images are shown. Scale bars: 200 μm; original magnification, ×10. (A and B) Data represent the mean ± SD, n = 3. **P < 0.01 by 2-tailed Student’s t test. (C) Western blot analysis of MNK1, p-eIF4E, eIF4E, cyclin E1, and SNAIL in HBL and MM111 shCTL and shMKNK1+2 cell lines. (A and C) GAPDH is used as loading control.

