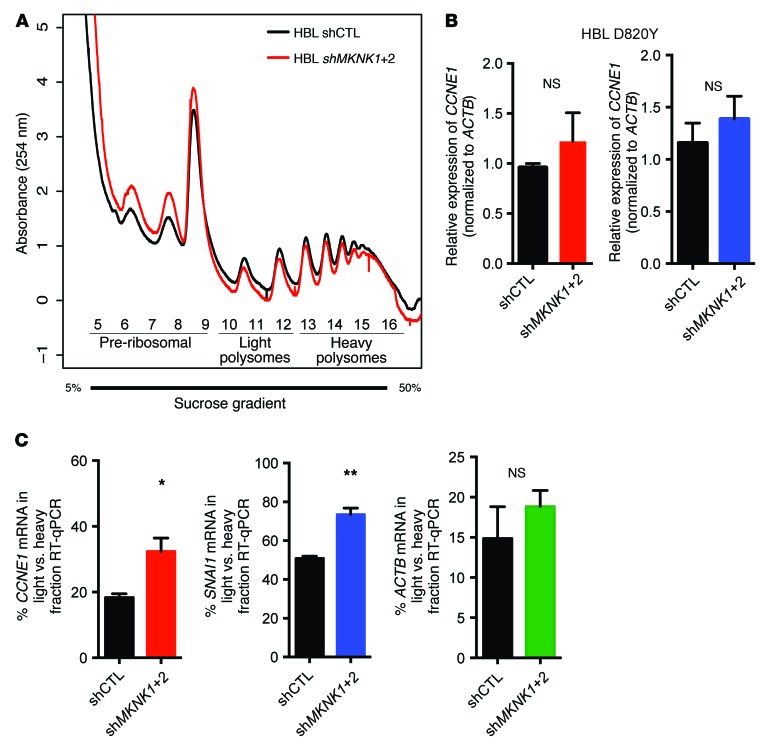
Figure 3. Inhibition of MNK1/2 impairs CCNE1 and SNAI1 mRNA translation in KIT-mutant melanoma cells.
(A) Absorbance profiles (254 nm) of sucrose gradients loaded with HBL shCTL (black) and shMKNK1+2 (red) cytosolic extracts. (B) RT-qPCR was performed to monitor SNAI1 and CCNE1 mRNA in HBL shCTL and shMKNK1+2 cell lines. Data represent the mean ± SD, n = 3. P > 0.05 by 2-tailed Student’s t test. (C) RT-qPCR was performed to determine the distribution of ACTB, SNAI1, and CCNE1 mRNAs in light versus heavy polysome fractions obtained from the sucrose gradient described in A. Data represent the mean ± SD, n = 3. *P < 0.05, **P < 0.01 by 2-tailed Student’s t test.

