Fig. 2.
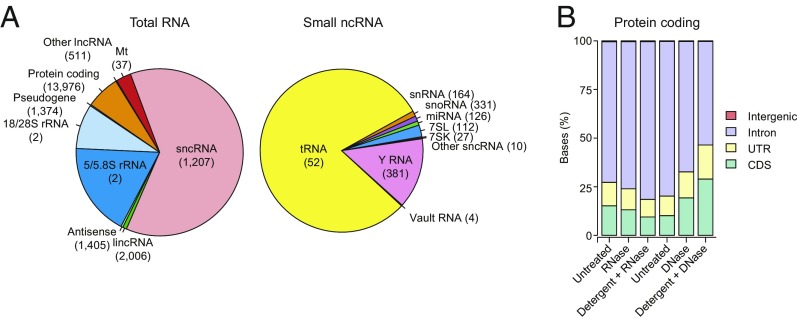
RNA biotypes associated with EVs and the effect of nuclease and detergent treatment on reads mapping to different regions of protein-coding genes. (A) Pie charts of percentage of mapped total RNA and sncRNA reads (Left and Right, respectively) corresponding to the indicated features for untreated EVs. The number of genes represented for each RNA biotype is shown in parentheses. tRNA gene counts are for tRNA genes grouped by anticodon (n = 52, including two families of suppressive tRNAs that potentially recognize stop codons, SelCysTCA, and iMetCAT; see SI Appendix, SI Methods). SncRNA gene counts include pseudogenes. Pie charts of RNA biotypes within the same EVs after RNase or Protease + RNase treatment are shown in SI Appendix, Fig. S4 A and B. (B) Stacked bar graphs of the percentage of protein-coding gene reads mapping to coding sequences (CDS), untranslated regions (UTR), introns, and intergenic regions before and after different treatments. Different batches of EVs were used for the RNase and DNase protection experiments (left three bars and right three bars, respectively).

