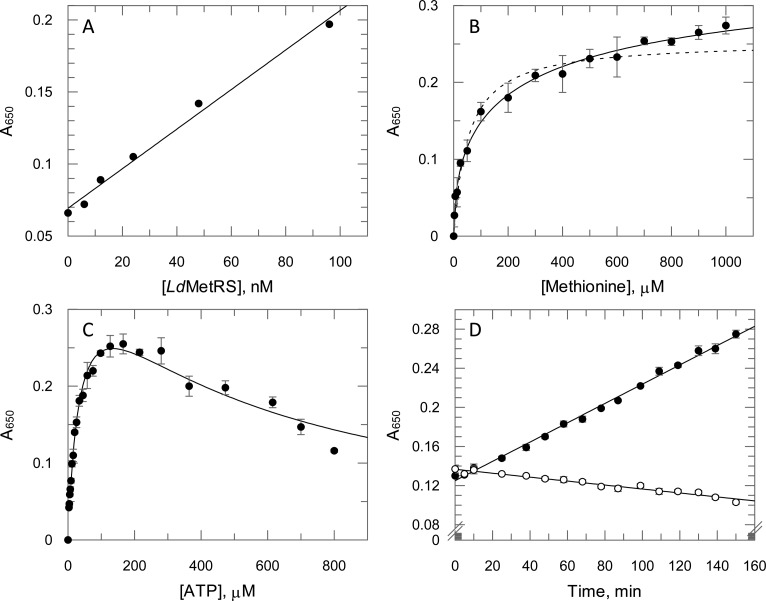
Figure 1.
LdMetRS assay development summary. (A) Linearity of the assay with respect to enzyme concentration. (B) Methionine Km determination in the presence of a saturating concentration of ATP (200 μM). Solid line is best fit to Hill equation and dotted line to Michaelis–Menten equation. (C) ATP Km determination in the presence of a saturating concentration of methionine (1 mM). (D) Assay linearity with respect to time under the final assay screening conditions of 50 μM methionine and 100 μM ATP either with (closed circles) or without (open circles) 50 nM LdMetRS enzyme. Data are shown as mean ± SD (n = 3 technical replicates).

