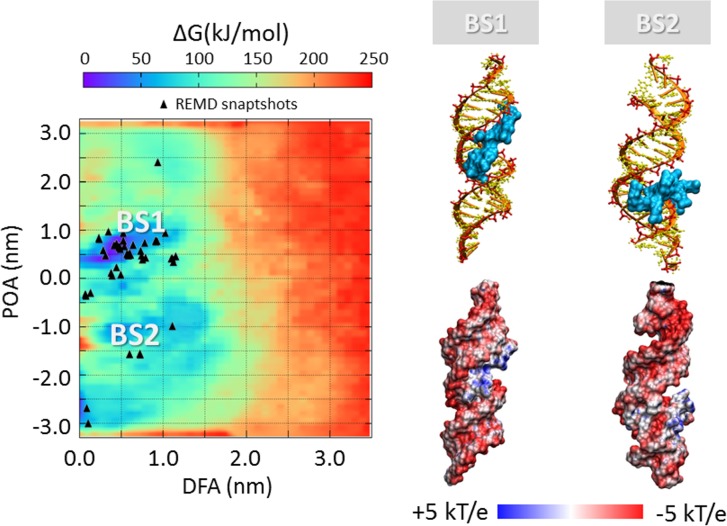
Fig 7. Free energy profile (kJ/mol) of siRNA-polyARG interaction represented as function of siRNA-polycation distance from the major inertia axis of the target siRNA (distance from axis-DFA) and the projection of the siRNA-polymer distance on the major inertia axis of the target siRNA (projection on axis-POA).
The free energy minima computed by metadynamics are compared with the system configurations sampled by REMD simulations (black triangle). The deepest binding site is highlighted with BS1. The visual inspection of each binding site is reported together with the corresponding electrostatic map (right). Potential isocontours are shown at +5kT/e (blue) and -5kT/e (red) and obtained by solution of the LPBE at 150 mM ionic strength with a solute dielectric of 4 and a solvent dielectric of 78.4.

