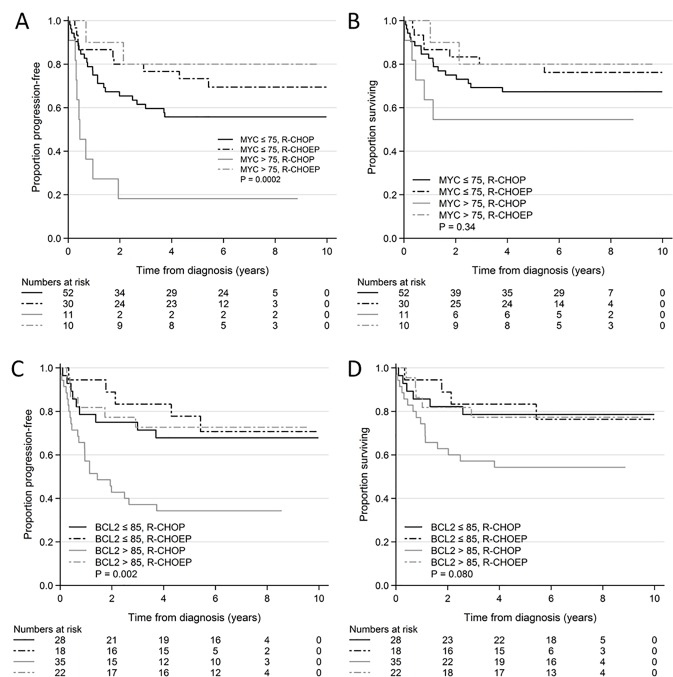
Fig 1. Kaplan Meier curves of MYC and BCL2 overexpression in R-CHOP and R-CHOEP treated patients.
A: PFS, MYC>75% and MYC< = 75% in R-CHOP and R-CHOEP treated patients. B: OS, MYC>75% and MYC< = 75% in R-CHOP and R-CHOEP treated patients. C: PFS, BCL2>85% and BCL2< = 85% in R-CHOP and R-CHOEP treated patients. D: OS, BCL2>85% and BCL2< = 85% in R-CHOP and R-CHOEP treated patients. Abbreviations: PFS, progression free survival, R-CHOP, rituximab, cyclophosphamide, doxorubicin, vincristine, prednisone; R-CHOEP, rituximab, cyclophosphamide, doxorubicin, vincristine, etoposide, prednisone; OS, overall survival, P, p-value reflecting comparison of all 4 arms.

