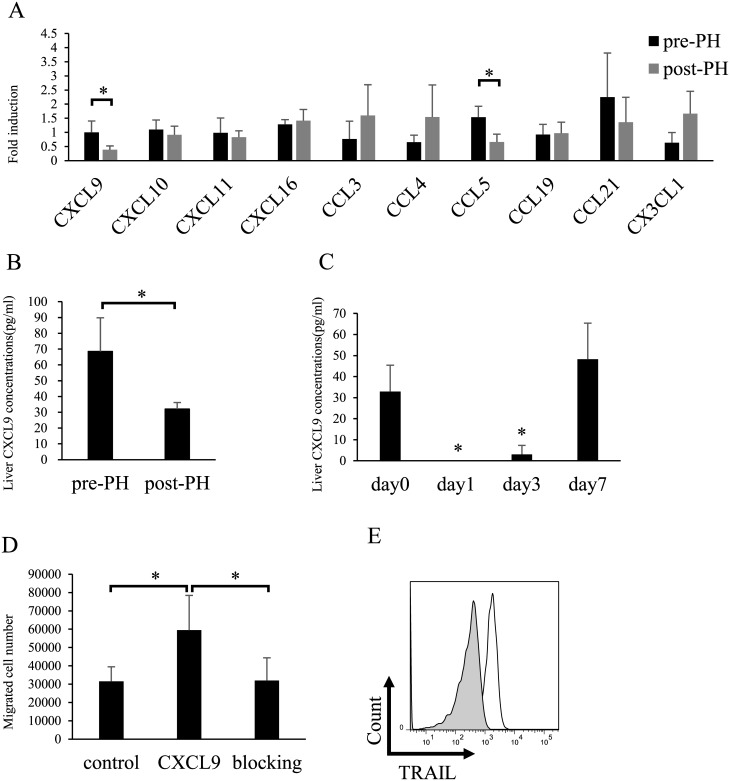
Fig 2. Intrahepatic CXCL9 expression decreases significantly after hepatectomy.
(A) Gene expression levels of various chemokines in the liver were analyzed by quantitative real-time PCR. Numbers represent gene expression levels of various chemokines before and 3 d after partial hepatectomy (n = 6). (B) Protein levels of hepatic CXCL9 were measured by cytometric bead arrays before and after partial hepatectomy. The numbers represent the liver concentrations of CXCL9 for each group (n = 5). (C) Kinetics of liver CXCL9 after partial hepatectomy, as measured by cytometric bead array (n = 3). (D) Migration of liver NK cells in the presence of CXCL9 compared with that in presence of an isotype control. A CXCL9-blocking antibody attenuated migration (n = 5). (E) Representative histogram of TRAIL expression on migrating NK cells into the outer well. Shaded and open curves represent isotype-matched controls and TRAIL staining, respectively. Data are expressed as means ± SD. Statistical differences were detected by paired Student’s t-tests (*p < 0.05).

