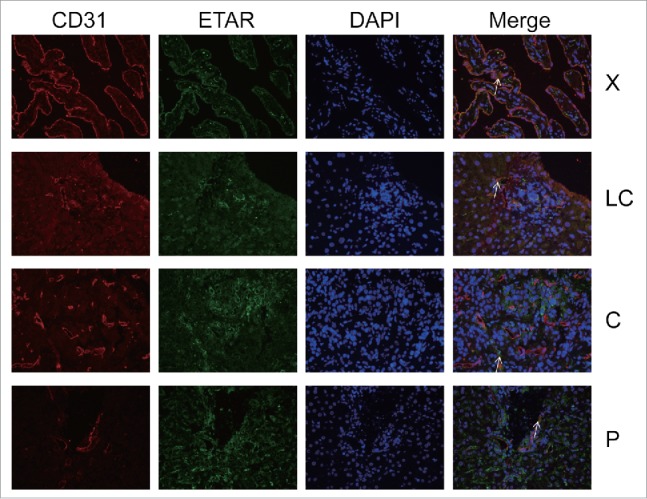
Figure 4.

ETAR expressions in HSECs. CD31 was a positive control for HSECs. White arrowheads indicated dual staining and/or close proximity of α-SMA and ETAR expression which could be visualized in merged images. X: hepatic hemangioma; LC: liver cirrhosis; C: liver cancer; P: para-carcinoma.
