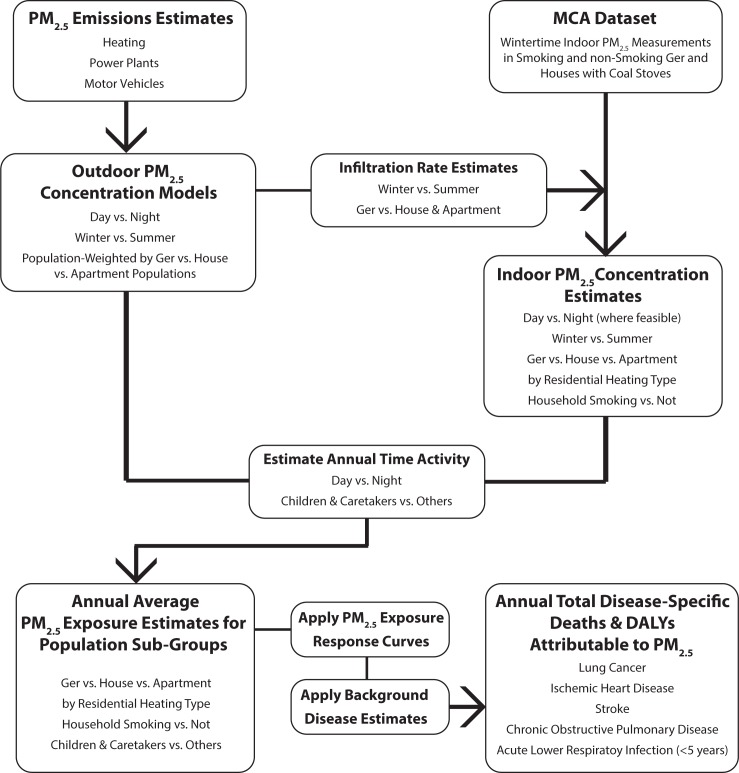
Fig 1. High-level flow chart of the general exposure and disease analysis approach.
Annual average exposures were estimated for population sub-groups in 2014 and in 2024 under BAU and two alternative policy pathways from outdoor and indoor concentration models and time activity estimates using the approach summarized above. These exposures were applied to disease-specific exposure response curves to produce estimates of population attributable fraction (PAF) which were applied to background disease rates to quantify attributable disease burden. Detailed data descriptions and methods–including how interim year (2015–2023) disease burdens were calculated–are included in the manuscript and S1 Text.

