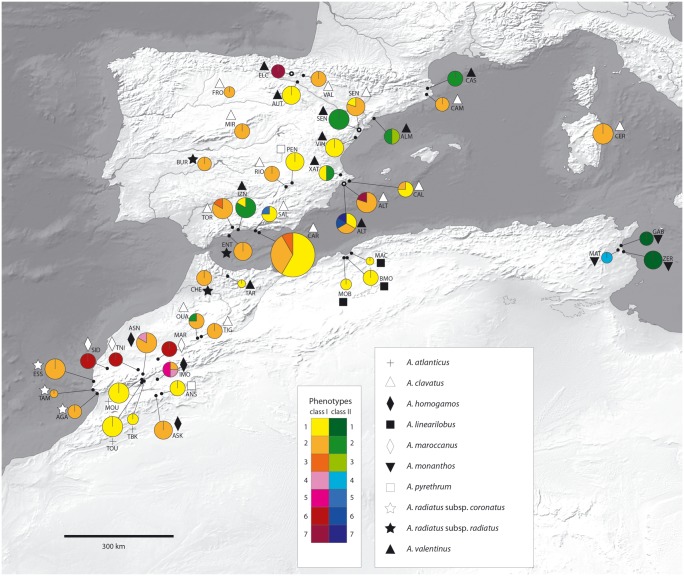
Fig 4. Geographic distribution of karyological ribosomal phenotypes in Anacyclus.
Circle size is proportional to the sampling in each population. Sympatric populations of A. clavatus and A. valentinus are indicated by an empty dot. See Fig 2 for phenotype descriptions. The map is made with Natural Earth. Free vector and raster map data @naturalearthdata.com.

