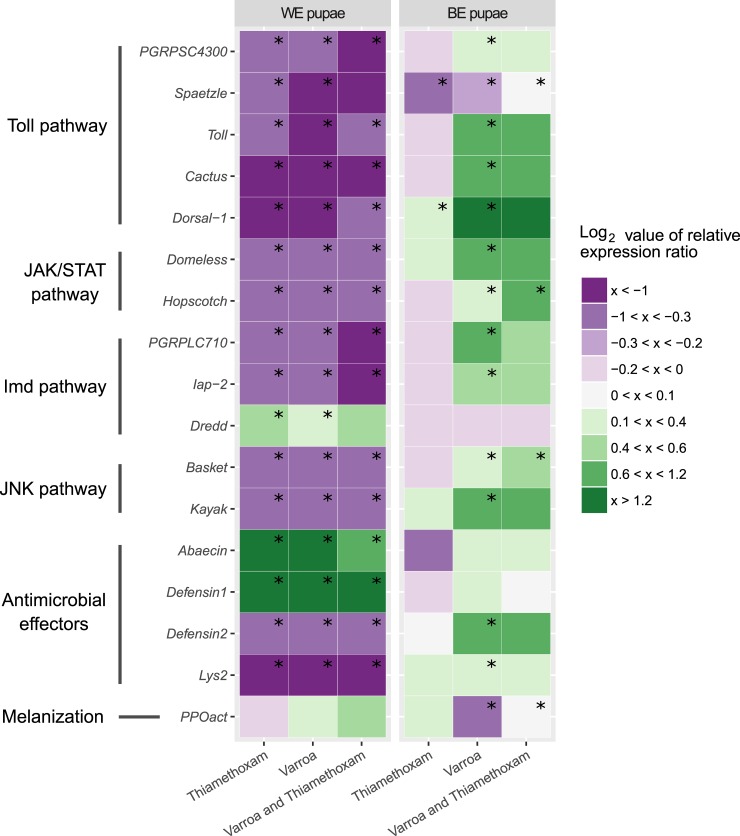
Fig 1. Heatmap of differential expression of immune-related genes in white-eyed and brown-eyed pupae.
The colors indicate the average mRNA levels compared to average levels of mRNA in control groups: purple indicates lower and green higher levels. Range log2 value of relative expression ratio is indicated in the legend on the right. Each column corresponds to the expression profile of one treatment (Thiamethoxam; Varroa; Thiamethoxam and Varroa) and each row, to one gene transcript. The immune-related gene names and corresponding immune pathway are indicated on the left. Boxes marked with symbol (*) shows statistically significant effect of treatment on gene expression if the p-value was equal to or less than 0.05.

