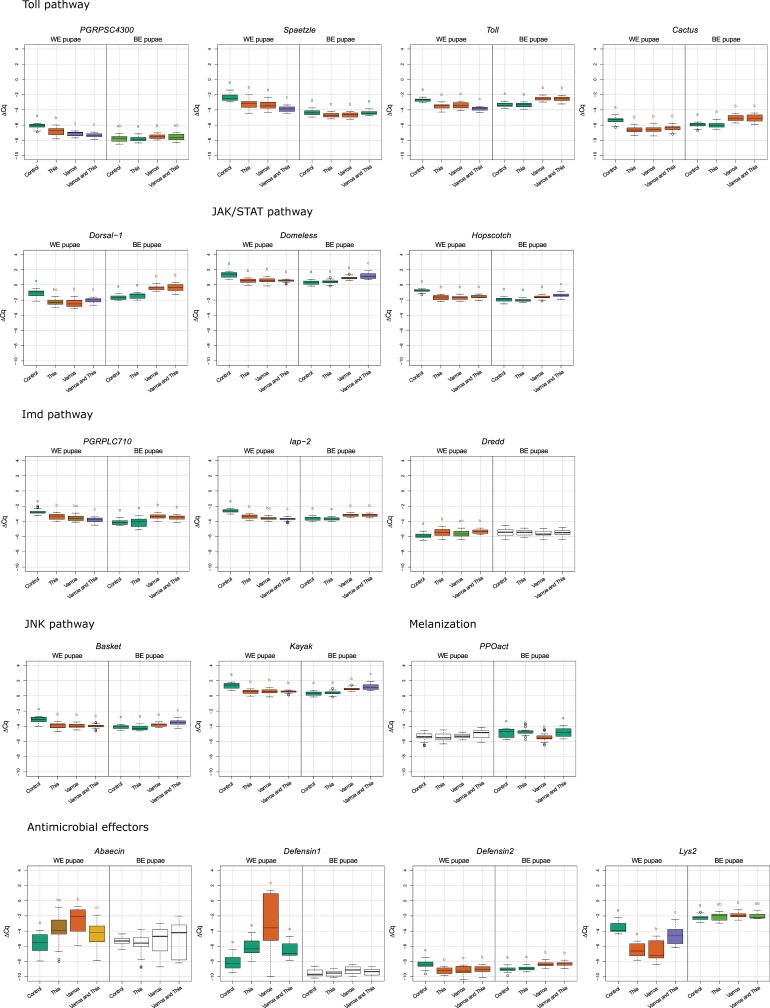
Fig 2. Box plot diagrams for immune-related gene expression.
Each box plot represents the ΔCq values measured for biological replicates for selected treatment and developmental stage. Treatments sharing the same letter are not significantly different from one another within the same developmental stage. Treatments are indicated in the scale at the bottom of the plots: Control; Thia: thiamethoxam; Varroa; Varroa and Thia: Varroa and thiamethoxam. Analysis was undertaken with program R. The results demonstrating the level of gene expression are shown in log2 scale.

