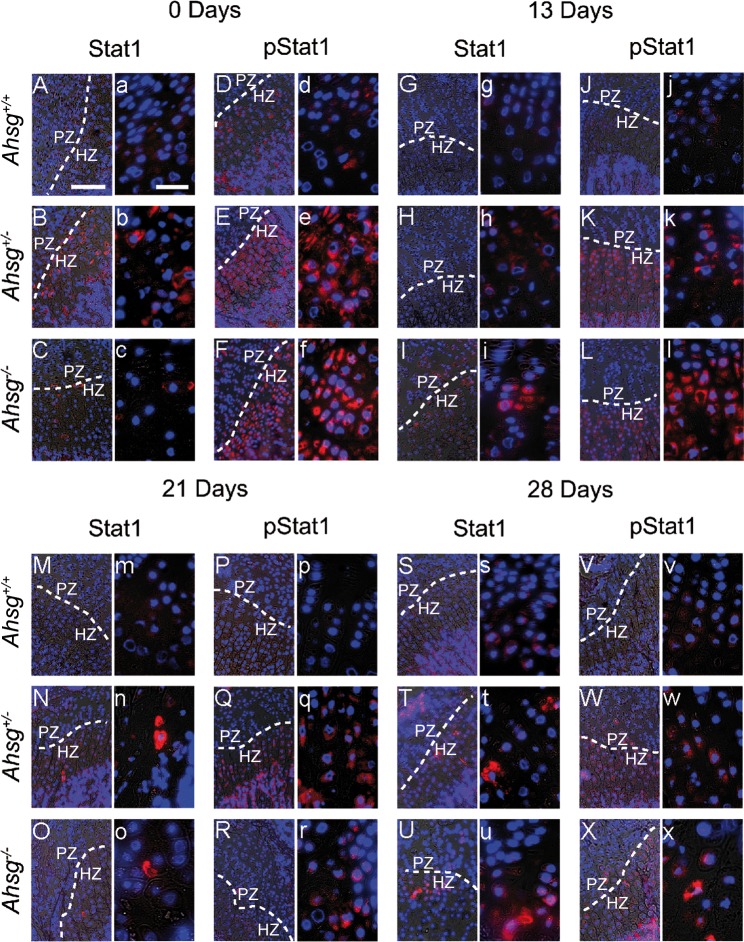
Fig 6. Immunofluorescent localization of STAT1 and phospho-STAT1 (pSTAT1) in distal femoral growth plates.
Decalcified paraffin sections were stained with antibodies for STAT1 and pSTAT1 (red) and nuclei were counterstained with DAPI (blue). The figure shows representative micrographs for each time point and each genotype recorded with a 20-fold (uppercase letter) and a 63-fold lens (lowercase letter). STAT1 and pSTAT1 signal was mainly localized in the hypertrophic zone. The signal was increased in Ahsg+/- and Ahsg-/- mice of all ages. Scale bars are 150 μm for micrographs taken at lower and 20 μm for micrographs taken at a higher magnification.

