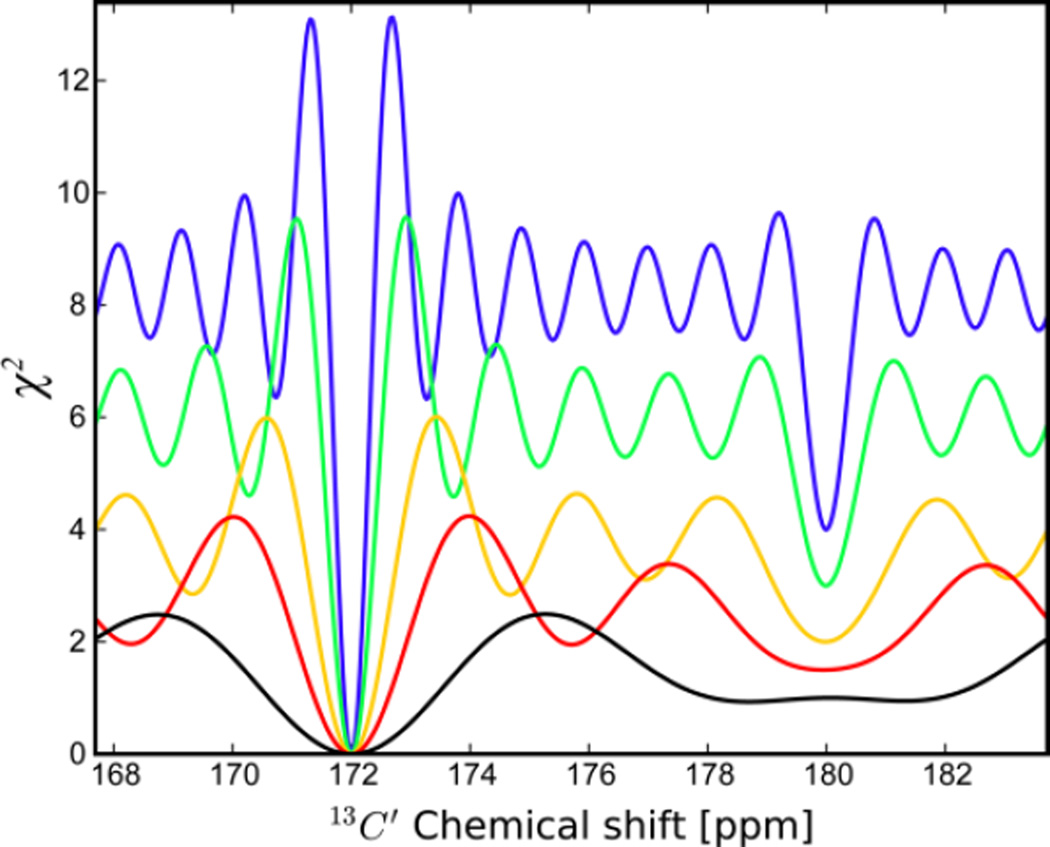
Figure 2.
Goodness of fit χ2 profiles when fitting a single chemical shift to time-domain data of the sum of two distinct frequencies. Simulated data were generated with two frequencies at 172 and 180 ppm with relative populations of 0.75 and 0.25, respectively, which were fit to Eq. (2). The number of complex points used in the fits are 4* (black), 6* (red), 8* (yellow), 12* (green), and 16* (blue). Importantly, the location of the χ2 minimum of the dominant peak remains invariant independent of the number of points used in the fit.

