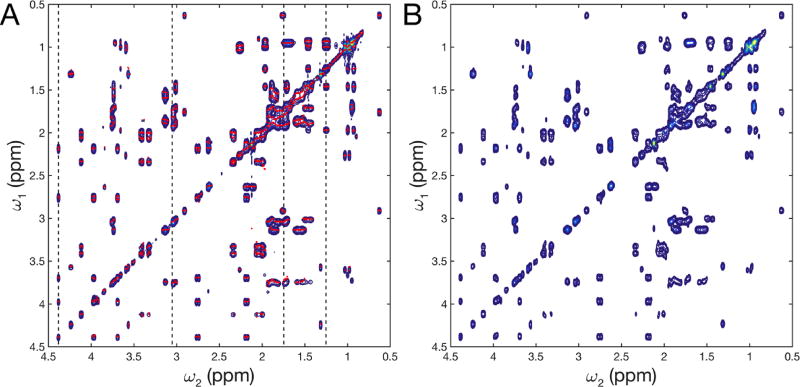
Figure 2.
AMS analysis of 2D 1H-1H TOCSY spectrum of a 14-compound metabolite mixture with a long mixing time of 97.8 ms. A) 2D FT TOCSY spectrum (blue contours) using 256 complex points and AMS results using only 16 complex points (red dots). B) Reconstruction of 2D spectrum from AMS results by 2D Gaussian convolution. Dotted lines in (A) indicate traces shown in Figure 3.

