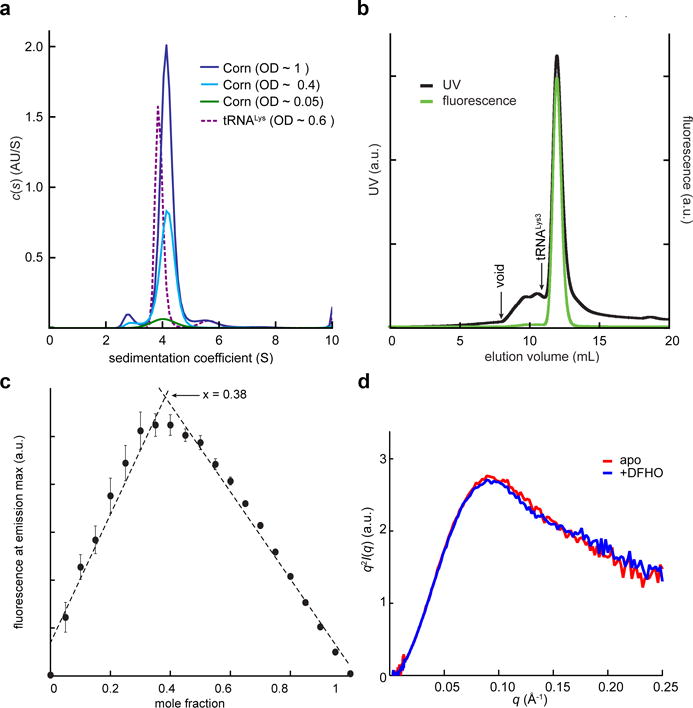
Figure 2.

Biophysical analysis of Corn-DFHO dimer. (a) Non-normalized c(s) distributions for Corn RNA at three concentrations and tRNALys3 at a single concentration. (b) Fluorescence-size exclusion chromatogram (F-SEC) for the Corn-DFHO complex. Absorbance was monitored at 260 nm and fluorescence at the emission maximum (543 nm). Arrow denotes void volume (8 mL) as determined by an independent run with blue dextran (MW ~ 6 MDa) under identical conditions. Elution volume of the 76 nt tRNALys3 (10.9 mL) in an independent experiment under identical conditions is also indicated. (c) Job plot23 for DFHO binding to Corn RNA. The fluorescence at the emission maximum (543 nm) was measured as a function of molar fraction [DFHO]/([DFHO]+[Corn RNA]). Mean and standard errors of three independent experiments (Supplementary Fig. 2b). The maximum (0.38), indicates 2:1 stoichiometry of RNA to DFHO. (d) Kratky analysis of experimental free- and DFHO-bound Corn RNA SAXS data.
