
Figure 5. Initial kinome target profiling of T. gondii CDPK1 inhibitors.
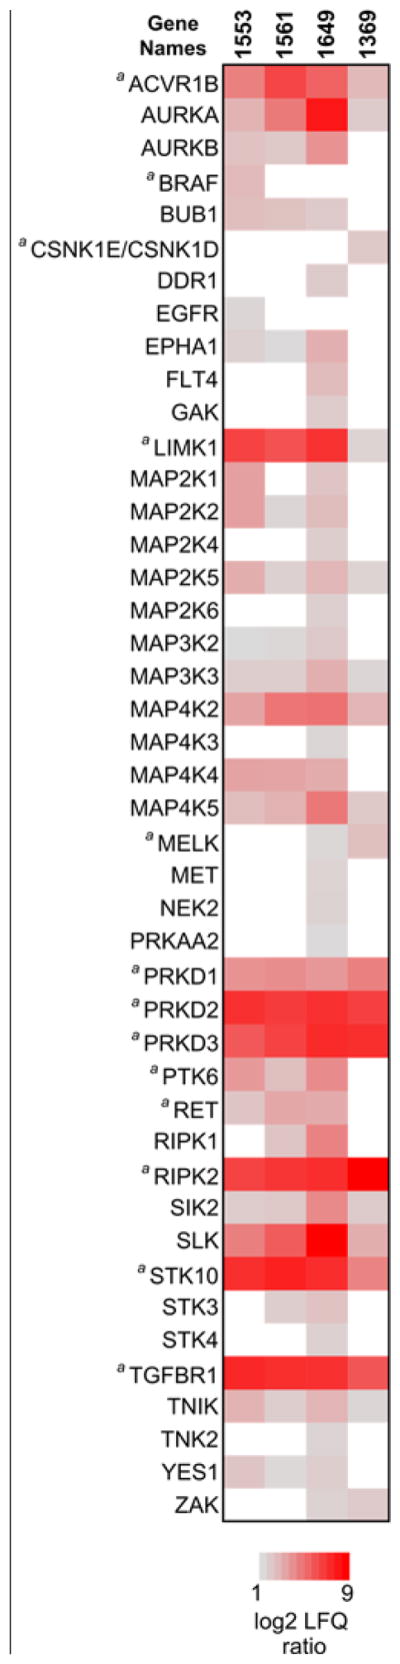
The heat map shows all putative drug-kinase interactions detected in the kinobead-competition assay at 50 μM 1553, 1561, 1649, or 1369 in the LFQ master mix. The panel’s color scale indicates the mean log2 LFQ ratios from 5 replicate LFQ pulldown experiments. For 1553, one replicate LC-MS run failed, so only four replicates were used for the analyses. Hits had to fulfill two criteria: (1) a log2 LFQ ratio ≥1 (i.e. 2-fold) and (2) a FDR <0.05 in a moderated two-tailed, two sample t-test of log2 LFQ protein intensity values from DMSO ctrl against competition experiments. a: one or more LFQ ratio values were obtained by data imputation.