. 2017 Oct 31;6:e27854. doi: 10.7554/eLife.27854

Figure 4. Spatio-temporal activity of mosquitoes in the field can be mapped using acoustic data collected by mobile phone users.

(A) Sample spectrograms from female Culex spp. (top) and Anopheles spp. (bottom) mosquitoes captured in the field at Ranomafana in Madagascar. (B) Frequency distributions for field-caught Culex spp. and Anopheles spp. mosquitoes in Ranomafana, forming a reference for identification of recordings from either species at this field site. Acoustic data were collected for 3 minutes each, from 50 individual Culex and 10 individual Anopheles mosquitoes. (C) Map of Ranomafana village showing distribution of female Culex spp., Anopheles spp., and Mansonia spp. mosquitoes, from mobile phone data recorded by 10 volunteers over the approximately 1 km X 2 km area. Each square represents one recording, and black circles indicate locations where volunteers reported encountering no mosquitoes. The numbers in the white boxes show the number of Culex (pink) and Anopheles (gray) mosquitoes captured in CDC light traps over the same time period at those locations. The map shows a spatial gradient from riverbank to hillside in the relative proportion of Anopheles spp. and Culex spp. mosquitoes. Further, mosquito hotspots are interspersed with points having a reported lack of mosquitoes, highlighting the potential importance of factors such as the distribution of water and livestock. (D) Spatio-temporal activity map for female Ae. sierrensis mosquitoes in the Big Basin Park field site, using data collected by 15 hikers recording mosquitoes with their personal mobile phones, over a 3-hour period in an approximately 4.5 km X 5.5 km area. Each brown square represents one Ae. sierrensis female recording, and black dots represent sites where hikers reported encountering no mosquitoes at all. (Inset top left) Temporal distribution of the overall mosquito activity data depicted in (D) based on recording timestamps, showing the rise and fall in the number of recordings made, a proxy for mosquito activity, in each hour of the field study.

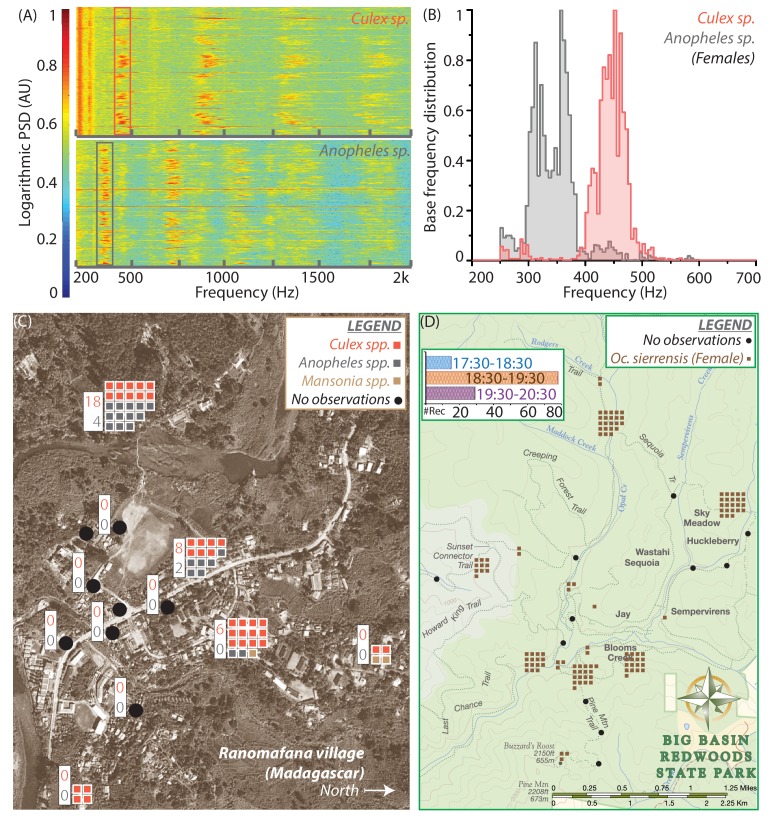
Figure 4.

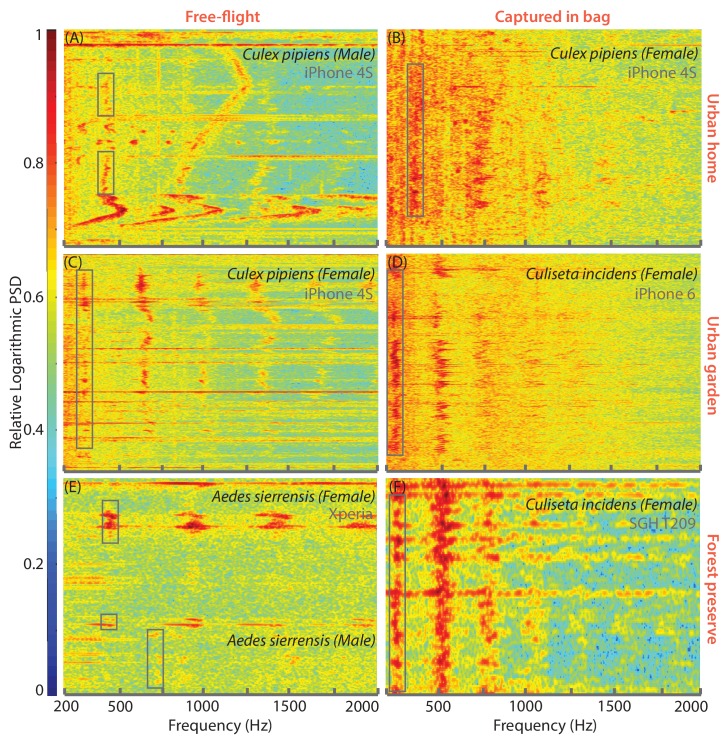
Figure 4—figure supplement 1. Mobile phones are capable of acquiring mosquito sounds in a variety of field environments.

Figure 4—figure supplement 1.

(A-F) Raw spectrograms of acoustic data acquired by various mobile phone users in different field conditions, with base frequencies of mosquito sounds highlighted by a box. The signals include sources of noise such as human speech, fire truck sirens, and birdsong, and were acquired in both urban (A-D) and forested (E,F) environments, including indoor (A,B) and outdoor (C-F) settings. Mosquitoes recorded were wither followed in free-flight (A,C,E or captured in a plastic ziploc bag prior to recording (B,D,F). All spectrograms show raw spectra without background correction or noise removal, and show the spectra from extraneous acoustic sources (speech, sirens) to distinguish the characteristics of mosquito spectra from other sounds. Spectrograms A-F correspond to sounds in Supplementary file 27.
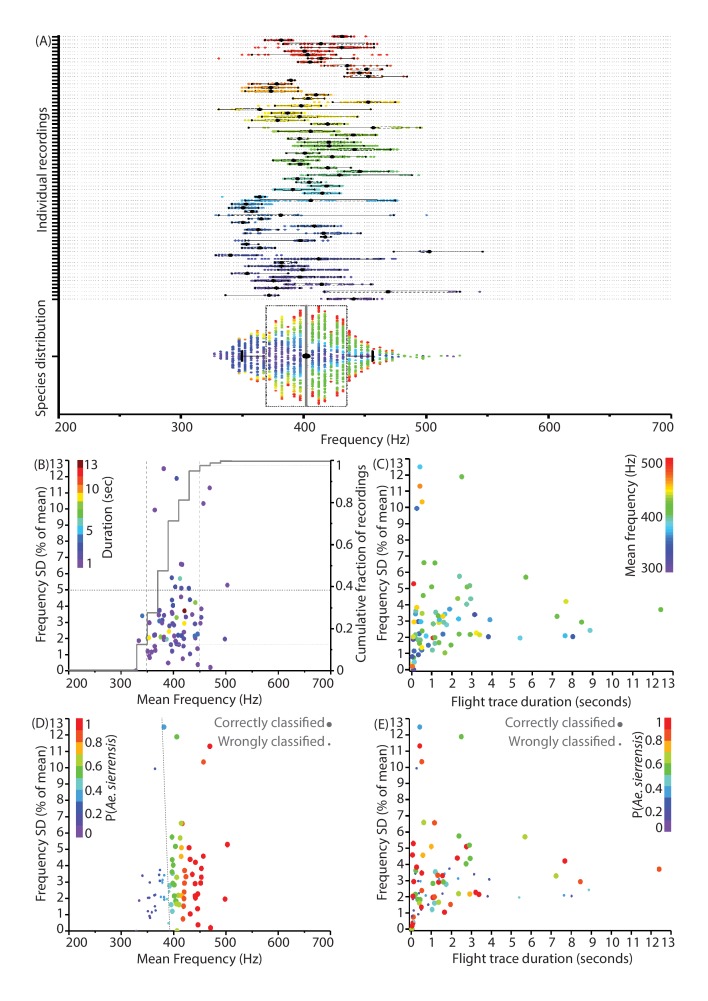
Figure 4—figure supplement 2. Individual flight traces for wild mosquitoes show highly similar mean frequencies with small but intrinsic variances.

Figure 4—figure supplement 2.

(A) Distribution of wingbeat frequencies for 74 representative recordings of wild female Aedes sierrensis mosquitoes from Big Basin Redwoods State Park, CA, USA. The bottom distribution shows the overall species wingbeat frequency distribution for Ae. sierrensis aggregated from all recordings, with the colour of each data point corresponding to its contributing flight trace. The even distribution of the colours across frequency for the overall species distribution indicates that most individual flight traces have similar frequency distributions, means and variances. (B) Plot of mean frequencies of individual flight traces against their corresponding standard deviation as a percentage of the mean. The gray line indicates cumulative fraction of recordings, showing that 85% of recordings have mean frequencies clustered between 350 and 450 Hz, with the vast majority having frequency spreads of less than 5% of the mean. (C) Plot of duration of flight traces against the relative standard deviation, coloured by the value of mean frequency, shows no correlation or clustering between these characteristics. However, there appears to be a minimum spread of about 2% of the mean for most flight traces, irrespective of duration or mean frequency, which appears to correspond to inherent natural frequency variations within flight traces. (D) Variation of classification accuracy for flight traces with relative standard deviation and mean frequency of the trace. For D and E, the colours represent the probabilities of classifying the trace as Ae. sierrensis using the MLE algorithm. Larger dots indicate those that were correctly classified, while small dots represent traces that were incorrectly classified as one of the other local species - Cx. pipiens, Cx. quinquefasciatus, Cx. tarsalis or Cu. incidens. In D, the grey-dashed line represents the boundary between traces that were correctly and wrongly classified. Classification accuracy is observed to be solely a function of mean frequency of the trace, corresponding to the overlaps of wingbeat frequency distributions. (E) Variation of classification accuracy for flight traces with relative standard deviation and duration of the trace. There is no relationship observed between correct classification and the recording duration or frequency spread of the trace.