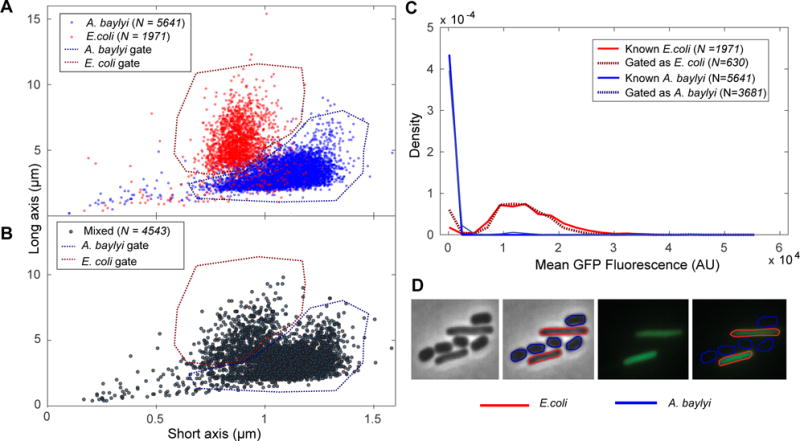
Fig. 1. Identification by morphology verses fluorescence. Panel A.

A dot plot of long and short axes for the A. baylyi (blue) and E. coli (red) cells, imaged separately. Based on this data, appropriate gates for A. baylyi and E. coli based on morphology are selected (dotted). Panel B: A dot plot of long and short axes for the mixed A. baylyi and E. coli cells, with the A. baylyi and E. coli gates from Panel A applied. Panel C: Histogram of mean GFP fluorescence for known A. baylyi (solid blue) and E. coli (solid red) cells, as well as mixed cells sorted as A. baylyi (dotted blue) and E. coli (dotted red). We find that the fluorescence data for the mixed cells sorted by morphology closely match the fluorescence data for the known populations. Panel D: Bright field and fluorescence images of a sample field of view, with and without cell outlines determined by morphology and fluorescence gates.
