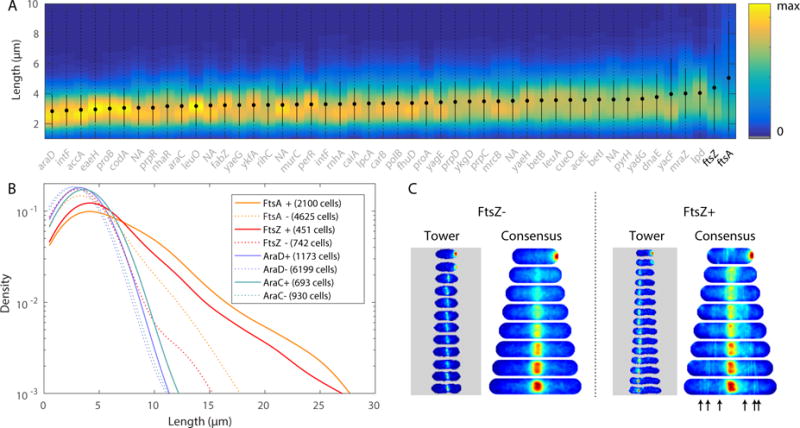
Fig. 3. Over-expression phenotypes. Panel A.

KDE of cell length (at death) for 48 strains (including ftsZA fusion strains) and statistics: minimum to maximum (dotted), mean (circle) and standard deviation (solid line). Genes labeled as NA are currently not annotated genes in MG1655. Strains are ordered by mean length. Panel B: Analysis of high (+) and low (−) expression sub-populations of four strains. High-expression sub-populations of FtsA and FtsZ have long length. Panel C: Single cell tower and consensus images for FtsZ high and low expression sub-populations. The consensus image for the + sub-population shows a cloud around midcell, reflecting the averaging of tower images of z-rings with aberrant localization. Arrows have been included to point out the various clouds of higher intensity, localized away from cell center, resulting from misplaced z-rings in many cells.
